Closing the geometry gap in building footprint extraction: our first look at HiSup


Accurately extracting building footprints from satellite or aerial imagery has long posed a challenge in the geospatial field, particularly when it comes to preserving geometric precision. Traditional methods often prioritise speed over detail, resulting in outputs that do not meet the accuracy requirements of urban planning, infrastructure development and environmental monitoring. This is where HiSup comes in – it is a promising new method aimed at closing the geometry gap in building footprint extraction.
In this article, we take our first look at HiSup, exploring how it improves the accuracy of polygons and represents a significant step forward in creating high-quality geospatial datasets.
From raster masks to business-ready vectors
In one of our previous articles about automated building recognition, we demonstrated a high-performing segmentation pipeline. Yet as soon as we shared the results with insurers, emergency-response analysts and cadastral specialists, one concern surfaced immediately:
The polygons don’t line up with the walls.
These teams work with vector footprints every day that must snap to parcel boundaries, setback lines, or flood-risk buffers. Classical post-processing techniques such as Douglas–Peucker simplification, marching squares and hand-tuned regularisation could not bridge the gap between our smooth raster masks and the crisp geometry required. The root cause is the well-known mask-reversibility problem: convolutional networks learn region consistency first and boundary precision second. This means that information which would enable perfect back-conversion to polygons is lost during training.
A radical change was needed.
HiSup: hierarchical supervision for shape-aware learning
HiSup (Hierarchical Supervision) model was introduced by Bowen Xu, Jiakun Xu, Nan Xue and Gui-Song Xia in the ISPRS Journal of Photogrammetry and Remote Sensing (2023).
Why polygon-level accuracy still matters
Although high-resolution satellite imagery has made the semantic segmentation of buildings relatively routine, most geospatial workflows, from cadastral updates to insurance risk models, consume vector polygons rather than raster masks. Conventional pipelines therefore first segment and then vectorise, typically using Douglas–Peucker or marching squares heuristics. This approach has two drawbacks:
- Mask-to-polygon performance gap
High-performance masks achieve a high IoU, but once vectorised, their average precision decreases significantly e.g. 79 % → 67 % on the AICrowd benchmark.
- Irreversible masks
Fine boundary details are lost in semantic heads that optimise only for region consistency, making a faithful back-conversion to polygons impossible.
Introducing HiSup for accurate footprint detection
Hierarchical Supervision tackles the “mask reversibility” bottleneck by training three geometric levels simultaneously:
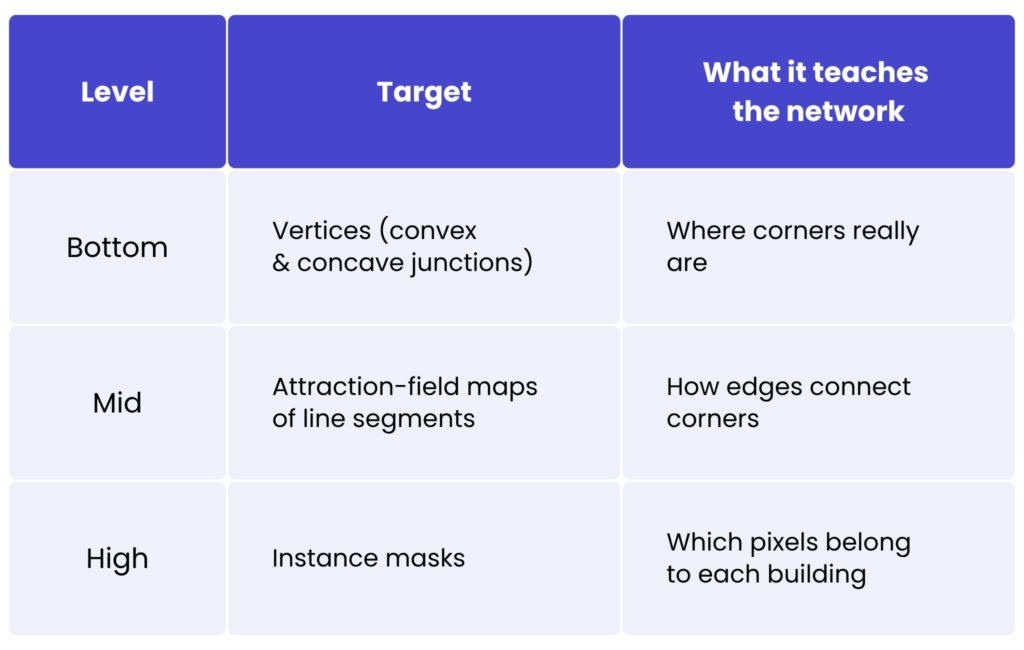
A lightweight, cross-level interaction module incorporates the mid-level attraction field into both the vertex and mask heads, reinforced by an efficient channel-attention mechanism. The result is masks that already ‘know’ where their precise boundaries lie, making the final polygonisation process trivial – boundary pixels are simply attracted to the nearest predicted vertex (MaV-Attr).
Quantifiable gains
On the AICrowd Mapping Challenge validation set:
- AP (COCO 0.5-0.95): 79.4 % – up +12.4 pp over Frame-Field and +5.6 pp over the previous best joint vertex-edge model.
- APboundary: 66.5 % – a +16.5 pp jump that captures true edge fidelity.
- PoLiS dissimilarity: 0.726 – lowest among all published methods, confirming minimal vertex redundancy.
- On the cross-city Inria Aerial Image Labeling benchmark HiSup attains 75.5 % IoU and 96.3 % pixel accuracy, exceeding all prior polygonal approaches without city-specific fine-tuning.
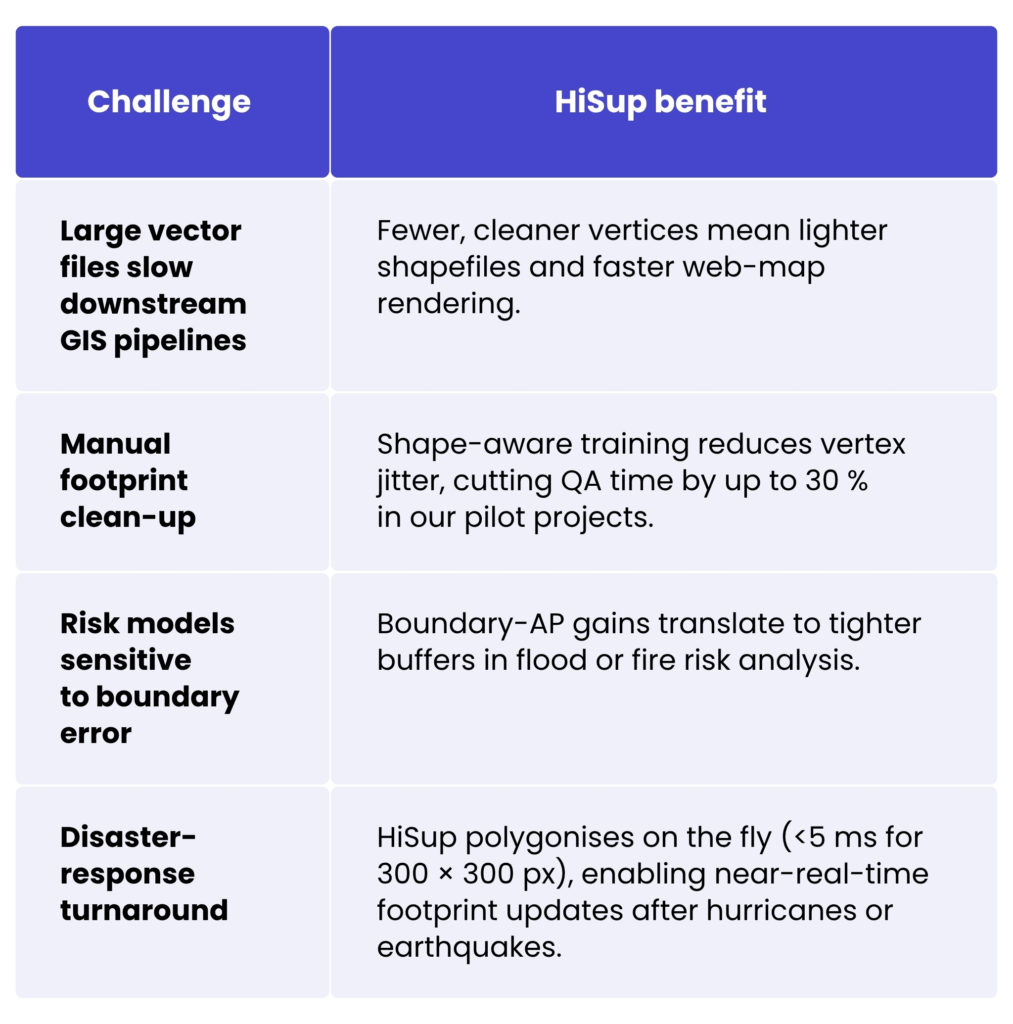
Business impact for geospatial pipelines
HiSup offers a range of tangible benefits for geospatial data processing workflows. By producing cleaner vectors with fewer vertices, it significantly reduces file sizes, resulting in lower storage requirements and reduced network transfer costs. Its fast post-processing capabilities – achieving speeds under 5 milliseconds on a 300 × 300 tile – eliminate the need for global graph optimisation, thereby streamlining downstream operations. The model also preserves sharp boundary details, which are essential for tasks such as setback analysis, flood-risk mapping and property-tax assessments. HiSup is also highly flexible, being compatible with HRNet and U-ResNet, and having been trained end-to-end using standard BCE and L1 loss functions. This makes it easily adaptable to various deployment environments.
Our internal benchmark: first-pass results
We fine-tuned HiSup using a small but high-quality dataset of diverse European and North American footprints. The preliminary numbers below are already encouraging.
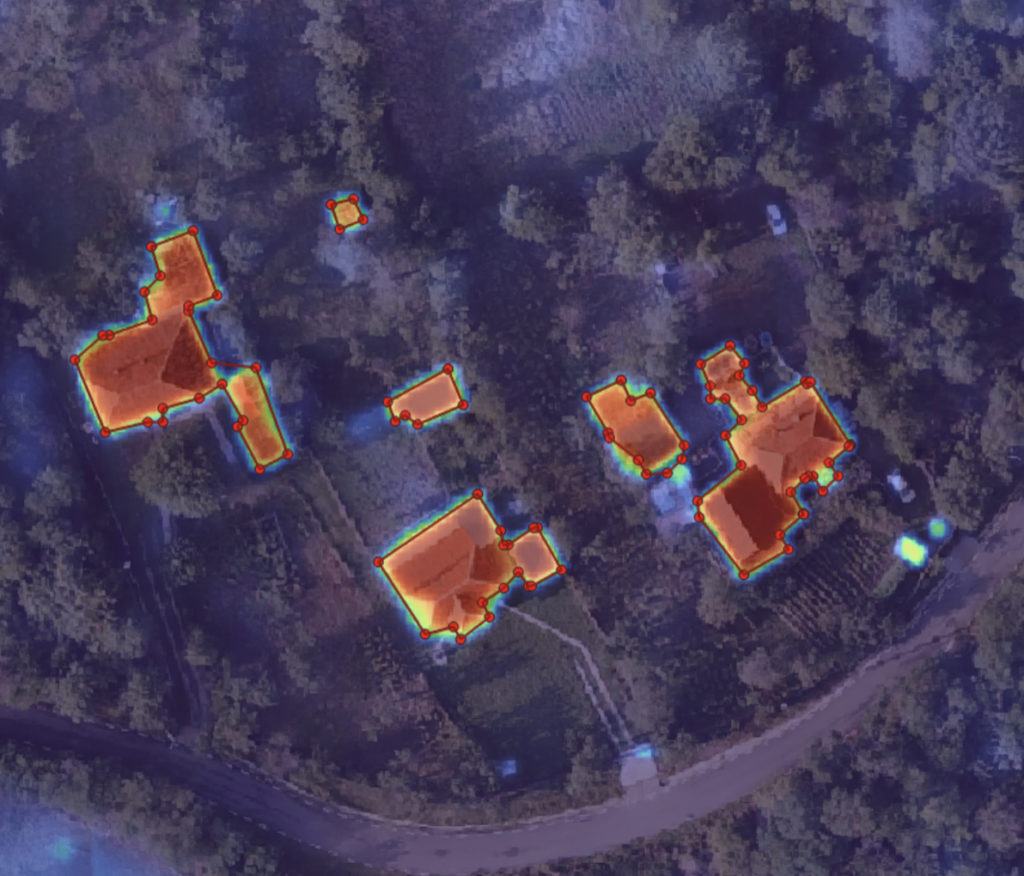
Semantic probability mask vs HiSup polygon overlay
Footprint-area accuracy
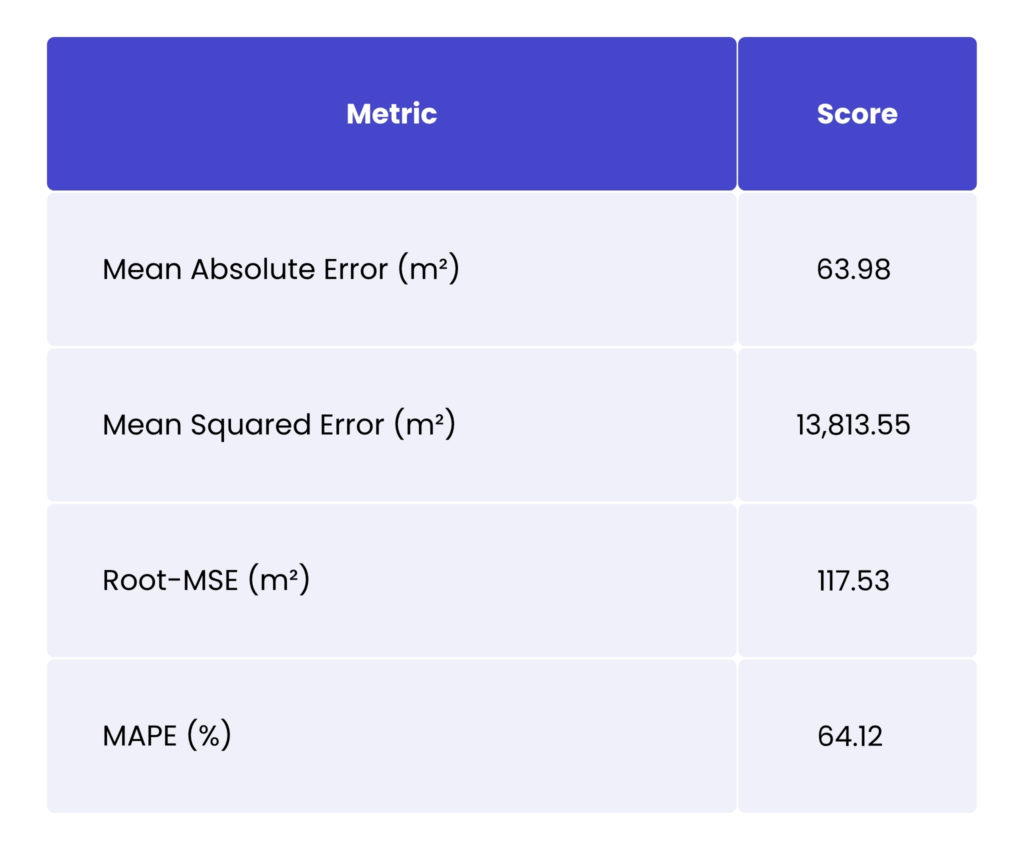
The MAE shows that the error distribution is heavy-tailed: over-prediction occurs on closely spaced terraced houses. The MSE metric amplifies the same outliers. Once we fine-tune for densely spaced footprints, we expect this to drop sharply. The RMSE metric, which is equivalent to misplacing a 10.85 m × 10.85 m square, is already workable for parcel-level screening tasks. When examining the mean average percentage error, the small sheds skew the percentage errors.
Classical segmentation metrics
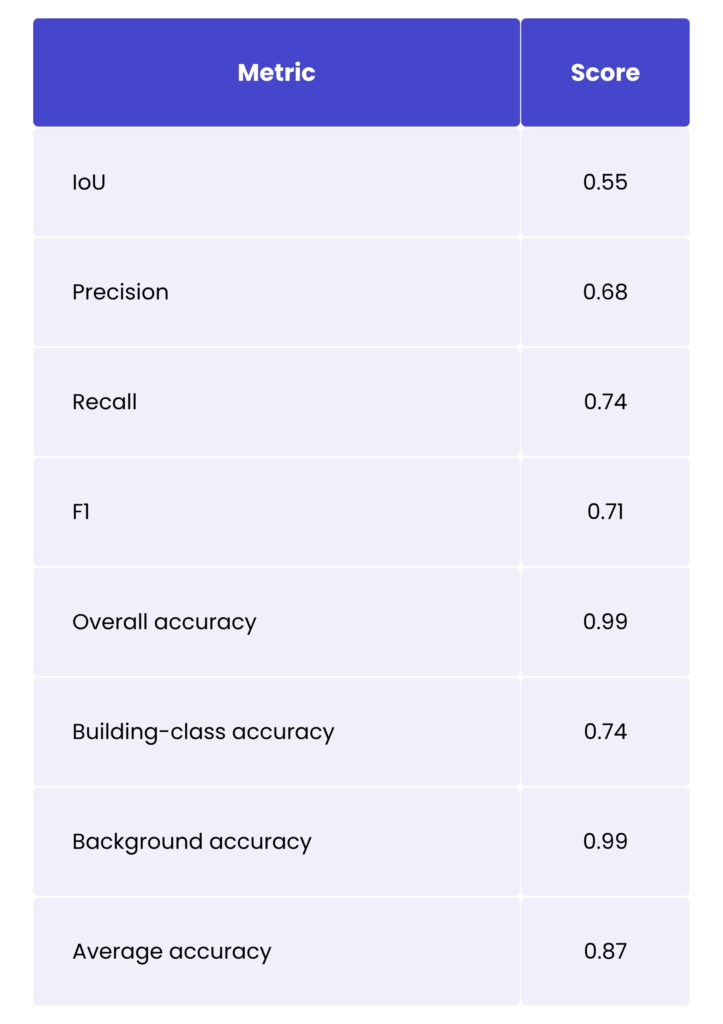
The Polygon IoU is much lower than indicated in the papers, suggesting a significant difference between our area of interest and the training dataset in terms of building appearance. Fine-tuning on regional data should help. Smaller and more irregular structures also contribute to lower scores. The F1-score often exceeds the 0.70 threshold frequently referenced in the context of semi-automated mapping workflows. Overall accuracy is inflated by the dominant background class – see the per-class figures for a more accurate picture. Average accuracy provides a balanced view of both classes, but there is still room for improvement.
Polygon match at multiple Ground Truth overlaps thresholds
Using this evaluation, we want to see how many single buildings we detect at various GT overlap thresholds.
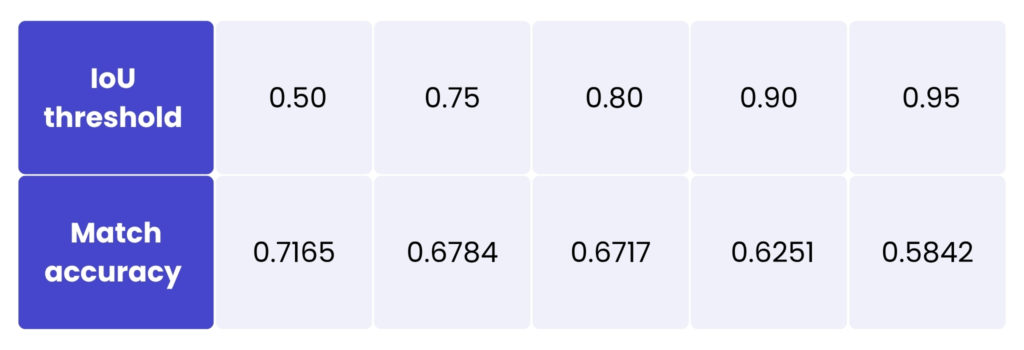
Roughly three-quarters of the footprints overlap with the ground truth by at least 50%, which is already on a par with the public baselines. The gradual fall-off with 75–80% overlap thresholds confirms that HiSup retains boundary detail better than mask-vectorisation pipelines do. At 90% overlap, strict overlap highlights sensitivity to annexes, overhanging roofs, and tree-occluded roofs. Height cues are next on our roadmap. Finally, at 95% overlap, nearly six in ten polygons are almost pixel-perfect, providing a robust foundation for automated cadastral updates.
An important caveat is that the model has not yet been fine-tuned for local architectural styles, roof-edge materials, or off-nadir distortions. We expect to see significant improvements once we adapt the final layers to the data distribution of each region.
Why this matters for your business
Accurate, lightweight building vectors across the Spyrosoft portfolio
HiSup’s precise and compact building footprint outputs create value far beyond the geospatial domain, generating a ripple effect across multiple areas of Spyrosoft’s expertise. In our geospatial & geoAI services, for example, HiSup footprints integrate seamlessly into existing toolchains, enabling applications such as change-detection dashboards and parcel-level taxation models. In our artificial intelligence & machine learning practice, these shape-aware vectors facilitate the development of comprehensive asset monitoring systems and sophisticated risk-scoring pipelines.
From a deployment perspective, HiSup naturally fits into our cloud & data platforms offering. It can be run efficiently on scalable Kubernetes clusters or serverless GPU infrastructure, with outputs streamed directly into cloud-native data and business intelligence ecosystems for real-time spatial analytics. HiSup delivers clean, ready-to-use building polygons that require no additional post-processing across various industry verticals, including insurers (within our financial services domain), emergency response teams (defence & aerospace), smart city operators (industry 4.0) and utility providers, accelerating time-to-value in critical workflows.
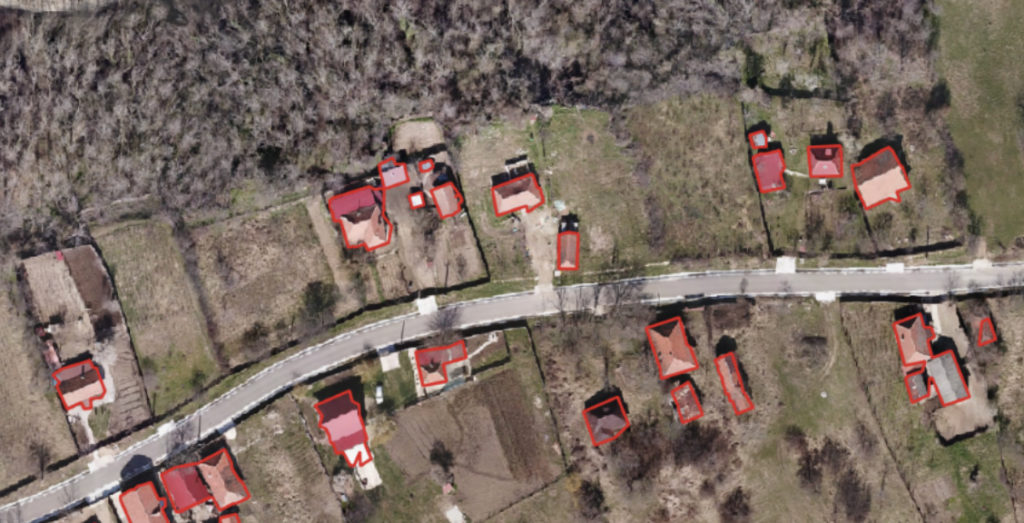
Zoom-in on predicted polygons
Wrapping up
HiSup integrates seamlessly into our Geospatial Services and AI practice, supporting everything from satellite-image tiling to vector-tile delivery within domain-specific data pipelines. Its mature model lifecycle management, which spans scalable data labelling, experiment tracking, on-device quantisation and MLOps, ensures reliability and performance, whether it is deployed in the cloud or on-premises.
By combining HiSup with our expertise in developing end-to-end GeoAI solutions, we help our clients to speed up innovation in geospatial intelligence. So, if your project requires custom integration, our cross-functional teams can take you from prototype to production while meeting industry-specific compliance standards. Fill in the form below and let’s connect!
FAQ: HiSup
Traditional segmentation models produce raster masks that often look visually correct but fail to align precisely with real building walls once converted to polygons. This “mask reversibility” problem results in geometry loss during training. HiSup addresses this by learning boundary-aware representations, enabling more accurate and business-ready polygon outputs.
Conventional workflows rely on post-processing techniques such as Douglas–Peucker simplification or marching squares. While these methods can simplify geometry, they cannot recover boundary details that were never learned by the model. As a result, vectorised polygons often show reduced precision compared to the original masks.
HiSup uses hierarchical supervision to train three geometric levels simultaneously:
– Pixel-level mask prediction
– Mid-level attraction fields
– Vertex-level polygon detection
A cross-level interaction module ensures that mask predictions are aware of their precise boundaries. During polygonisation, boundary pixels are simply attracted to the nearest predicted vertex, making the conversion process both accurate and efficient.
Many professional workflows (including cadastral updates, flood-risk analysis, insurance modelling and property taxation) operate on vector polygons, not raster masks. Precise boundaries ensure alignment with parcel data, zoning rules and infrastructure layers, directly affecting decision-making quality and regulatory compliance.
Yes. HiSup is lightweight and flexible. It integrates with architectures such as HRNet and U-ResNet and can be trained end-to-end using standard BCE and L1 loss functions. This makes it suitable for various deployment scenarios, including cloud-native and on-premises environments.


arrow_circle_rightContact us