What is geospatial mapping, and how does it work?

For many people, the solutions generated by geospatial mapping are fully integrated into everyday life. From finding a location on the map and choosing the fastest way to get there, to monitoring crops and managing natural disasters. It can also be essential to understand patterns and make informed decisions in areas like environmental science and urban planning.
In this article, created in collaboration with our expert Michal Lupa, we share valuable insights into the process of geospatial data collection and mapping, as well as explain how and where geospatial technologies can be used.
What is geospatial mapping?
Geospatial mapping is a wide definition of all the operations involved in the process of creating maps that use geospatial data. It includes a whole group of operations like data collection and spatial analysis leading to the visualisation of a spatial object on a map.
Geospatial mapping can be described as a form of spatial visualisation technique that helps to create customised maps suited to particular needs. The purpose of GM is to show objects that have geographical coordinates against some geographical context, in order to present a model of the real world on a map. Different techniques, solutions, and software of Geographic Information Systems (GIS) can be used to analyse available geospatial data and geographical and terrestrial databases.
Stages of geospatial mapping process
Geospatial mapping consists of building spatial data visualisation layer by layer. An example topographic map is nothing more than the assembly of those. It includes layers of geospatial data, graphic layout, and cartographically correct design of a map in a specific order, so that in the end they constitute one coherent model of space and its final view.
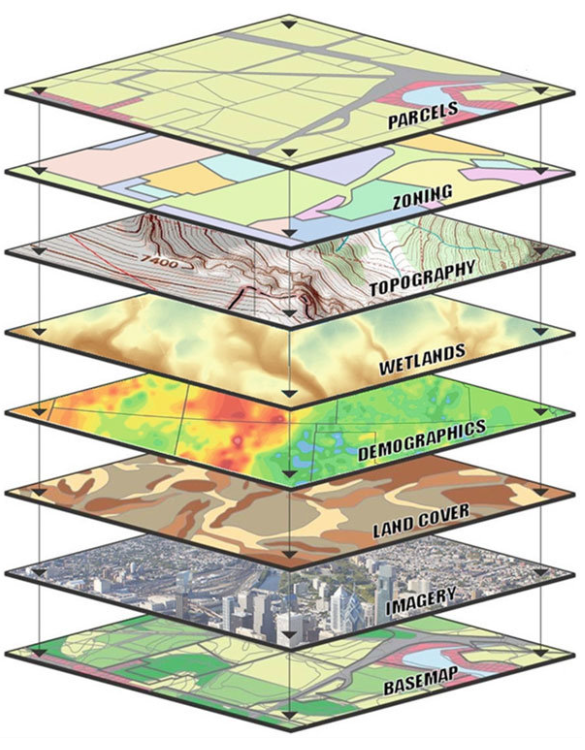
Source: https://www.researchgate.net/figure/Different-layers-of-data
Geospatial mapping can be seen as a process with 4 stages:
1. Geospatial data acquisition
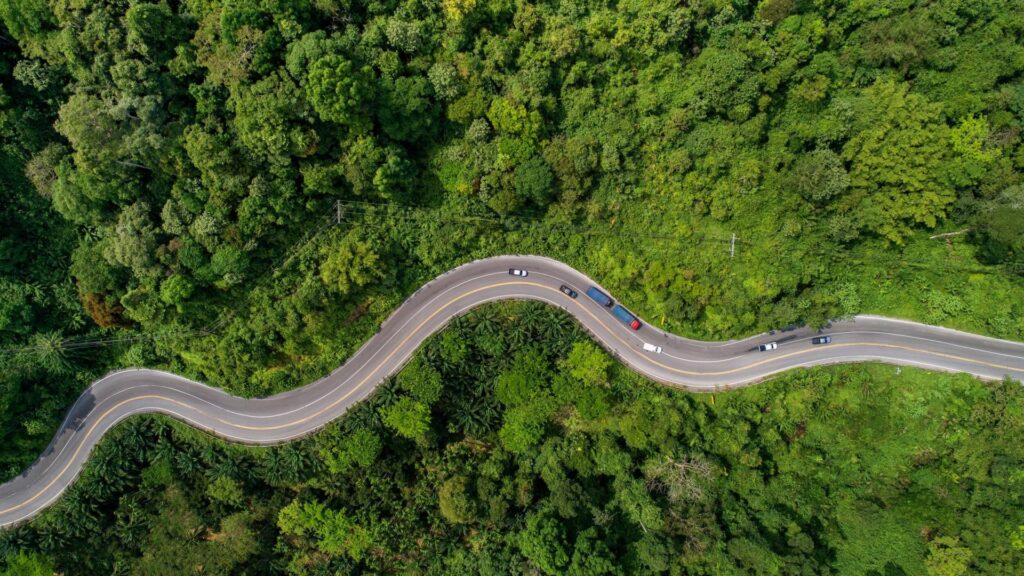
The first stage requires the collection of primary and/or secondary data. The sources and type of data vary and depend on the nature of the phenomenon we work with. They can be acquired, as one of many examples, through the collection of geodetic measurements or through aerial, drone or satellite imagery. Aerial, satellite and drone imageries are taken with the use of sensors to collect various types of data. What’s worth noting about drone imagery is that it is collected in much higher resolution.
In general, remote sensing methods can use two types of sensors:
- Active sensors – generate their own energy source towards the target under investigation, and then detect and measure the reflected or backscattered radiation from the object.
- Passive sensors – search for natural radiation emitted or reflected by the targeted object. In this case, the most common radiation source is sunlight.
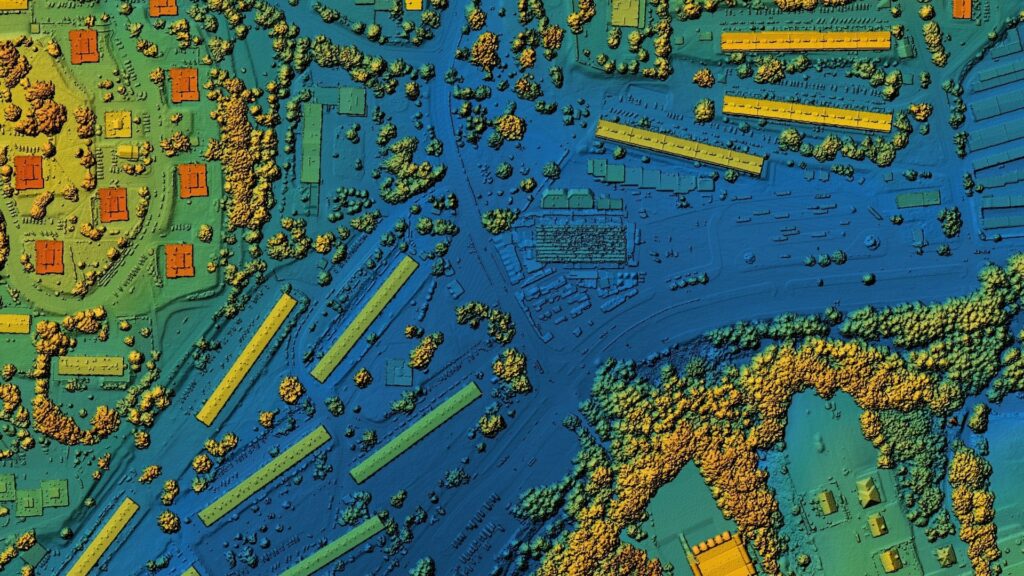
Remote sensing can provide us with many kinds of data, such as optical, LiDAR or SAR data. They can be captured, for example, in natural colours or infrared.
An example of classic (secondary) data acquisition is the vectorisation of already existing resources (e.g. old maps). The other subject of growing interest is the gathering of data through crowdsourcing (Volunteered Geographic Information – VGI), where users voluntarily participate in the creation of the content of the spatial databases.
The above are just a few examples that can form the basis for geospatial mapping and visualisation, among many others.
2. Data processing and input to databases
The collected data is processed to feed the relevant databases. Those bases store information about the raw geometry of objects without any graphic symbols. Moreover, they contain data about the location of objects in space and their exact borders if the nature of the data allows it. Those details alone are considered as spatial information that are sufficient for drawing conclusions and building various types of analysis. Details contained in such databases are then passed on to software programmes responsible for analytical functions. Based on them, we can further process these data and carry out spatial analyses.
3. Creating a model and design
Once we have the data in the appropriate database schema, processed in a way that allows us to use it further, the next stage involves creating designs and graphics for the map. In this process, symbols and colours are assigned according to specific cartographic rules, so that objects or places are as recognisable as possible, and the overall perception is understandable to the average user.
At this stage one of the most important activities in the map-making process takes place, that is, cartographic generalisation. In some cases, high accuracy data may need to be generalised. The use of data with a given precision depends strictly on the scale of each map. High precision information is required only for multi-scale models, but with medium- and small-scale maps, such high accuracy is not necessary. Cartographic generalisation is about reducing the accuracy of existing geometries and spatial objects in such a way that despite fewer details, the recognisability of objects and their locations is maintained. The generalisation process is conducted to reduce the amount of detail while keeping the highest possible information load in each map.
4. Publication
The last stage is the publication of the prepared product or a model as an exported map or as a map service that can be embedded in a website.
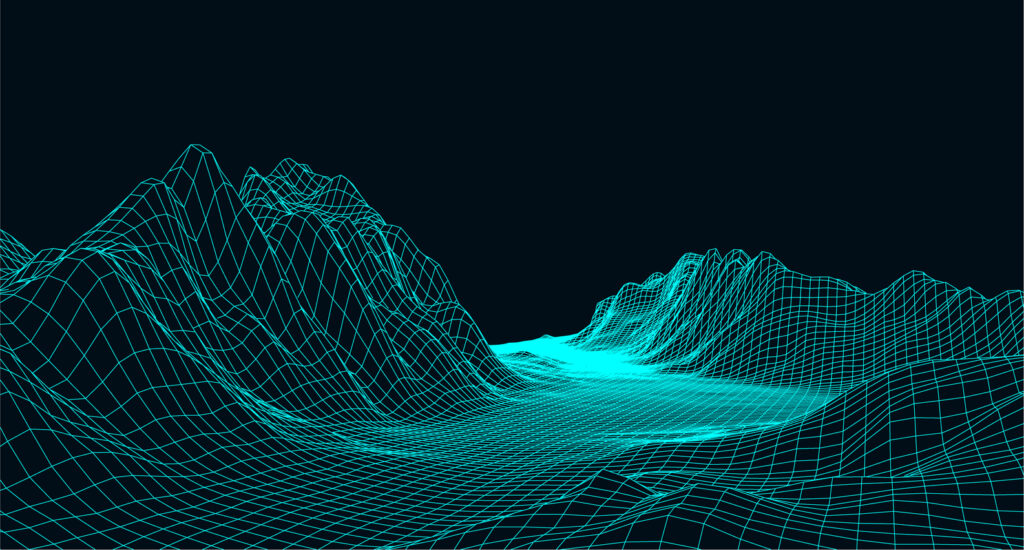
The steps above may concern topographic and thematic maps, as well as displaying points indicating location, for example from GPS, and placing them on the background of some existing map. In the last one, the base map is used as a background for the extra data layer we want to show, for example, the route from point A to B. Besides that, geospatial mapping also offers the possibility of creating 3D models, which are developed in a very similar way. This process allows a third dimension to be added to data and for them to be visualised in greater detail. It helps to show additional information like the scaled height of real-world objects. All that makes it easier to recognise patterns and non-obvious relationships, which can be useful in areas like urban planning, coastal and building modelling and disaster response.
Find out more about our geospatial services
Learn more
Technologies and tools in geospatial mapping
Geospatial mapping requires the use of certain geospatial technologies that play a significant role in the whole process. Those technologies provide data, which can be used in modelling, analysis, and visualisation of the map. They are also helpful in the case of making decisions based on relevance and priority of resources.
Geospatial technologies includes tools like:
GIS (Geographic Information Systems) – is a system that helps create, manage, analyse, and place various types of data on the map. The system is connected with maps and integrates localisation data with other relevant information. Thanks to GIS technology implementation, it is easier to understand patterns and geographical context.
GNSS – is a system with constellations of satellites that send signals from space and transmit position and time data to GNSS receivers. These receivers then use the collected data to determine the location. The system has global coverage and includes Europe’s Galileo, the USA’s GPS, Russia’s GLONASS and China’s BeiDou Navigation Satellite System.
Remote Sensing (RS) – is a process that helps to remotely collect geospatial data and satellite images provided by satellite sensors and airborne cameras. It uses reflected and emitted radiation of an area to detect and monitor its physical characteristics. It also can improve GIS mapping projects by being a source of useful data and information that supports analysis for geospatial assessment and modelling.
The use of those technologies now is easier than ever. With a simple search on the internet, you can find many accessible tools. Some of them can be used to read, manage, and analyse data, others can help to process specific information from satellites. Many tools also offer the possibility to share data or even create and then embed maps into any website. Some of those helpful tools are:
- QGIS
- ArcGIS
- ENVI
- SNAP
- Geokettle
- Geoserver
- Mapbox
- PostGIS
- Oracle Spatial
To find out more about spatial analysis tools used in geo sector, check out our introduction to geospatial analysis for business.
Where to use geospatial mapping?
Organisations and companies throughout the world are applying geospatial mapping for various reasons and in many different ways. Some of them are looking for extra business value, better navigation and planning or benefits for customers and employees. Geospatial mapping is commonly used in areas like:
- Changes and updates on maps
- Logistic and route optimisation
- Mapping quantities and densities
- Natural disaster management and prevention
- Military surveillance and defence
- Agriculture and field scanning
- Sustainability and environmental preservation
- Urban planning
Spyrosoft’s team has experience in collaborating with many different areas and projects. That includes preparing apps with typographic and aerial maps and creating the functionality to create outdoor activity routes and generating offline maps. Another example of our work was the creation of an application with an underground map of assets across utilities. The intention of the product was to help to take a closer look at the whole infrastructure to monitor defects in underground assets and navigate their repair in a less invasive manner. Our geospatial experts also collaborated in other projects for industries like retail and agriculture.
Over to you
The industries and fields in which geospatial mapping and services can be used are almost endless, and its benefits can be seen in both business and day-to-day life. If you need help with the implementation of geospatial mapping solutions in your organisation feel free to reach out to our team via contact form below.


arrow_circle_rightContact