Computer vision for agricultural robots: validating perception in unpredictable field conditions


Perception validation in computer vision for agricultural robots plays a crucial role in helping autonomous machines recognise crops, identify weeds, and detect obstacles in complex outdoor environments. Yet, real-world field conditions introduce challenges that controlled testing cannot fully capture. Changing crops, weather, light, dust, and field-to-field variations can significantly affect accuracy. This article examines how to validate perception under unpredictable conditions, measure performance against operational risks, and build safer, more reliable autonomous robots.
What reliable perception system changes for agricultural businesses
Every perception error has a consequence beyond the model. A crop classified as a weed can trigger an unwanted spray or mechanical action. A worker hidden by foliage can be missed until the remaining stopping distance is too short. An unnecessary stop can erase the labour savings that justified buying the machine.
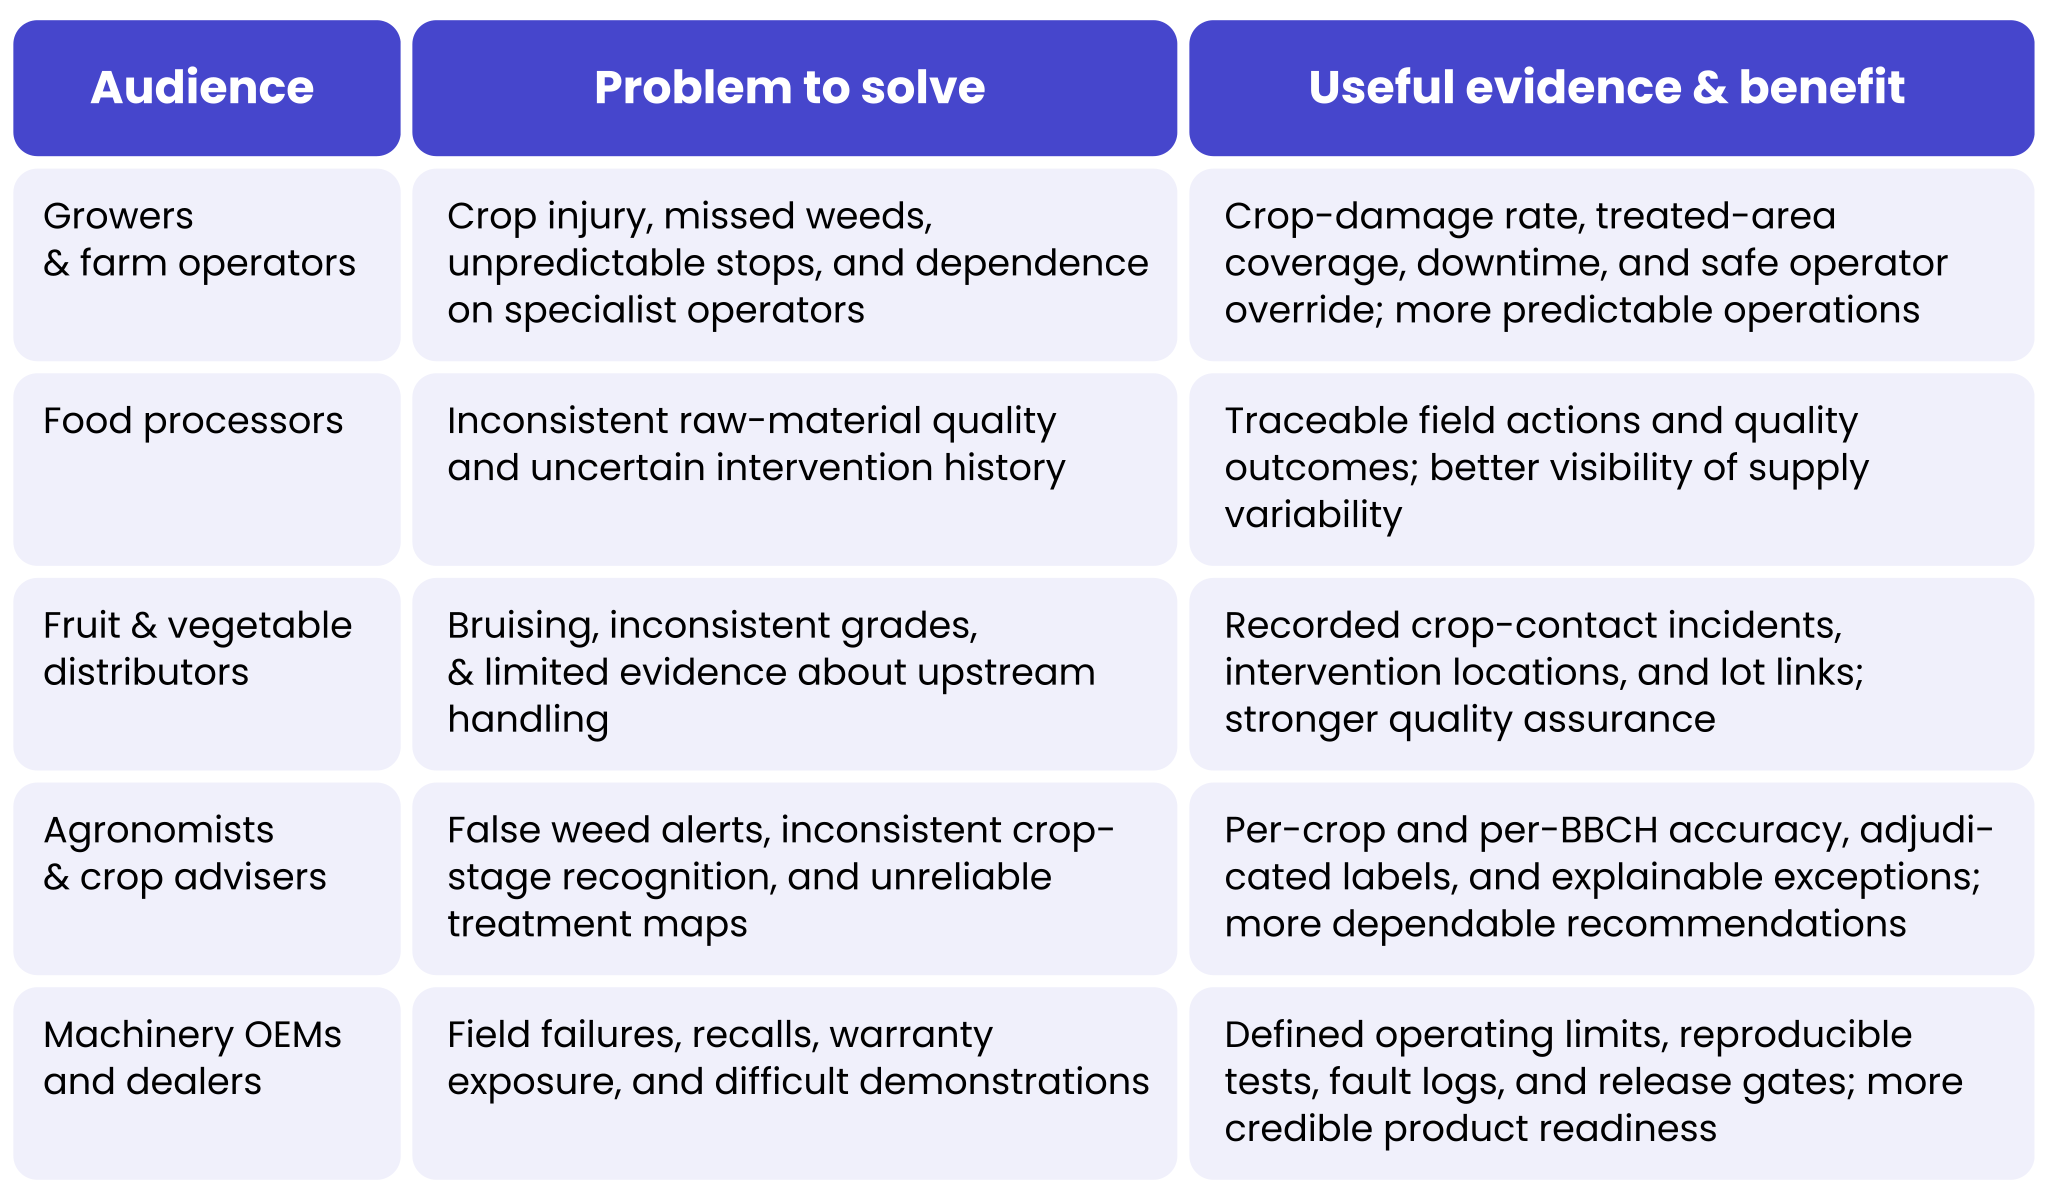
That is why validation should start with the operational and commercial decisions that the agricultural robot supports, rather than with a model architecture. For each audience, the relevant evidence is different.
Table 1. Business problems addressed by field-validated robot perception
This article continues our previous discussion of functional safety engineering for agricultural robotics. That earlier perspective concerns the whole machine architecture. Here, the focus is narrower: the perception subsystem and the evidence needed before an OEM relies on its outputs.
Why a detector benchmark is not proof of field readiness
A neural network may perform well on photographs collected at one farm while struggling on another. Background soil, row spacing, plant variety, camera mounting, lens contamination, and the season all alter what the computer vision model sees and what data reaches the agricultural robot. A standard average precision score also says little about how quickly a robot reacts, whether its confidence is meaningful, or what it does when it encounters an unknown object.
A 2026 open-access study by Liu and colleagues offers a direct warning. In one representative crop–weed detection experiment, mAP50–95 fell from 0.669 on the source dataset to 0.409 on the target dataset: only 61.1% of the original score was retained. Under a tested Gaussian-blur condition, the source-domain score dropped to 0.298. These findings apply to a specific benchmark and perturbation, not universal performance losses for agricultural robots [1].
Earlier work also shows both the potential and limits of image classification in computer vision for agriculture. The DeepWeeds dataset contained 17,509 field images spanning eight weed species. Olsen and colleagues reported 95.7% average classification accuracy for ResNet-50 and 53.4 ms average inference time per image in their experimental setup [2]. Those figures concern weed-species classification. They do not establish people detection, three-dimensional obstacle clearance, implement control, or a complete robot response time.
This distinction matters most when the same model supports both crop treatment and machine safety critical systems. Missing a weed reduces effectiveness; missing a child or animal in the travel path may create an unacceptable hazard. The two errors require different tolerances, safeguards, and validation methods.
Define the ODD before training computer vision for agricultural robots
An operational design domain (ODD) describes the precise conditions in which a robotic function is intended to operate. For agricultural computer vision technology and perception, it should be a measurable engineering contract, not a statement that the robot “works outdoors”. Without an ODD, there is no defensible denominator for test coverage or honest claim about readiness.
The following is an illustrative supervised strawberry-weeding pilot. Its limits are examples to be refined by the machinery OEM, agronomist, and safety engineer; they are not regulatory thresholds or claims about a specific product or solution.
Table 2. Example operational design domain for a supervised weeding robot

BBCH is the standardised crop growth-stage coding system; an “early plant” is not a sufficiently precise label. ODD boundaries should be observable through sensors and control logic. The system must know when it is outside its validated conditions, even if the AI model continues to return a confident label.
Agricultural robots: choose complementary sensors and validate their fusion
RGB cameras, multispectral cameras, LiDAR, radar, and positioning sensors answer different questions. The design objective is not to fit as many devices as possible, but to cover the relevant hazards with sufficient range, geometry, timing, and independence. No single sensor is reliable in every mixture of dust, sunlight, foliage and precipitation.
Table 3. Sensor comparison for agricultural robot perception

Sensor fusion, used in computer vision for agricultural robots, combines information from multiple sources. A camera may identify a crop, while LiDAR estimates the distance to its leaves; radar may provide a further moving-object cue. The result must include uncertainty, not just a merged label. Common-cause perception failures matter: rain can simultaneously degrade camera images and LiDAR returns, so two sensors do not necessarily offer two independent safety barriers.
Time alignment is just as important as sensor selection. The FieldSAFE research project collected approximately two hours of tractor-mounted recordings using cameras, LiDAR, radar, GNSS, and an inertial measurement unit. Its authors documented a typical delay of about 100 ms for one USB camera and delays of up to 4.5 seconds for a particular 360-degree camera setup [3]. Those historical figures are hardware-specific, but they demonstrate why timestamps, calibration, and stale-data rejection belong in the test plan.
Build datasets around field variation and rare events
A training dataset should represent the ODD; a validation dataset should challenge its edges. Randomly splitting adjacent video frames between training and testing creates leakage because neighbouring images often contain almost identical plants, shadows, and obstacles. A stronger test holds out entire fields, capture dates, camera units, or growing seasons.
A practical data programme follows six disciplines:
- Record the operating context: crop, variety, BBCH stage, soil type, illumination, rain, lens state, speed, and sensor configuration.
- Annotate at the right level: class labels, instance masks, object tracks, crop-safe zones, and the distance from a person or obstacle to the robot’s swept path.
- Audit disagreements: sample annotations for double review by an annotator and agronomist; adjudicate ambiguous emerging weeds and occluded crops.
- Seek rare but credible events: workers crouching behind leaves, animals entering from a headland, plastic film, fallen irrigation pipes, and mud covering a lens.
- Use augmentation carefully: exposure, haze, motion blur, and synthetic occlusion can diversify training, but must be checked against real sensor physics and reserved field data.
- Version everything: raw recordings, labels, class definitions, train/test splits, code, model weights, calibration and target-device firmware.
For crop recognition, a useful error review separates a weed from a crop volunteer, a dead plant from bare soil, and a young crop from an adult plant with overlapping foliage. For safety perception, a missed person behind a leaf must remain a test case even when the image looks too difficult for conventional classification.
Use metrics that reflect the operational risks tied to computer vision in agricultural robots
Mean average precision (mAP) remains useful for comparing object detectors, but it should not be the release decision. Acceptance criteria must follow what the robot can damage, how quickly it moves, and how much time remains for intervention. Report results by ODD condition and hazard severity, not only as one overall number.
Table 4. Risk-sensitive perception and control metrics

A simple timing calculation makes the safety relevance tangible. For a robot travelling at 1.0 m/s, with an assumed 0.25 s perception-to-brake delay, measured deceleration of 0.5 m/s² and 0.30 m of geometric margin, the nominal stopping requirement is 1.55 m: distance = speed × delay + speed² ÷ (2 × deceleration) + margin. This is an illustrative calculation, not a validated specification. Real designs must account for reaction-time tails, downhill travel, slippery ground, detection range, controller faults, and the particular safety function.
Even a result of zero missed hazardous encounters in 300 independent trials would leave a one-sided 95% upper confidence bound of roughly 1% for the underlying miss probability (the rule of three). In practice, staged encounters are often correlated, so this approximation can overstate the strength of the evidence. A “perfect” small pilot cannot demonstrate that dangerous failures are sufficiently rare.
Design for unknown objects, sensor degradation, and safe intervention
A production robot must handle cases outside its training set. An unclassified shape in the vehicle path should not be treated as empty space simply because it is not recognised as a person, animal, or tractor. The architecture should combine classification with occupied-space detection, sensor diagnostics, movement constraints, and safety-related supervision.
For example, if dust covers the forward camera of an agricultural robot or its sensor, the system should detect degraded image quality, check whether other validated channels still provide sufficient coverage, and apply the relevant operating restriction. A low-confidence output alone is not enough: neural networks can also be confidently wrong when presented with unfamiliar conditions.
The failure response should be explicit and testable:
- Disable or inhibit high-risk implement actuation when crop clearance or target identity is uncertain.
- Reduce speed only where the reduced-speed mode has its own validated detection and stopping envelope.
- Make a controlled protective stop when a critical sensor, localisation estimate, or safety monitor is unavailable.
- Provide the operator with a clear reason, safe recovery instructions, and a verified manual takeover path.
- Log the sensor state, decision, software version, operator action, and recovery outcome for root-cause analysis.
The independent safety-related control path and the requirements for a protective stop must follow the machinery risk assessment. Standards such as the ISO 18497 series and ISO 25119 are relevant design references, but passing the tests described in this article does not constitute conformity assessment or certification.
How to validate a perception system from recorded data to the field to ensure precision and field robotics safety
Validation should move from repeatable offline evidence to controlled real-world exposure. Each stage finds a different class of failure, and none can replace the others. The following sequence gives OEMs a traceable engineering workflow.
- Translate hazards into requirements. Define safety-relevant objects, minimum detection distance, allowed speed, implement exclusion zones, and stop conditions for each ODD cell.
- Freeze the evidence baseline. Lock camera calibration, model version, label ontology, and field/season-disjoint test sets before accepting performance results.
- Run recorded-data replay. Reprocess synchronised camera, LiDAR, radar, and motion logs; reproduce missed detections and confidence failures at frame and encounter level.
- Stress the model in simulation. Vary sun angle, partial occlusion, spray mist, object trajectory, soil background, and plausible lens contamination. Compare synthetic stress with real field captures.
- Test the integrated computer in software-in-the-loop (SiL). Exercise perception, tracking, planning, and stop-state logic together, including stale timestamps and invalid outputs.
- Inject hardware faults in hardware-in-the-loop (HiL). Disconnect sensors, delay messages, perturb calibration, overload compute, and verify that the real controller responds within the allowed time while dangerous actuators are isolated.
- Conduct staged, supervised field trials. Use controlled dummy obstacles and trained participants, verified exclusion zones, an independent safety observer, and gradually expanded conditions. Stop the trial at predefined fault thresholds.
- Review evidence before expanding the ODD. Link every failed requirement to a reproducible test, defect, corrective change, and repeat run; never transfer a pass from one crop or BBCH stage to another without evidence.
This approach extends the system-level argument from our previous article From smart farming to autonomous farming: perception, decision-making, control, and supervision must be verified as a connected real-time system, not as separate demo features.
The 10 field scenarios every agricultural robotics team should test
Successful daylight recordings on a clean field are not a representative acceptance campaign. A compact scenario matrix makes missing coverage visible to engineering, agronomy, and product management. The items below can seed a test catalogue, but each requires specific speeds, distances, sensor configurations, and pass/fail criteria.
Table 5. Priority perception test matrix for agricultural robots

For each row, test both the intended response and the absence of an unsafe action. A stop event is not a pass if the hoe, cutter, or spray valve continues operating after the vehicle has stopped. The complete swept volume of the vehicle and attachment must be considered.
A measurable gate for supervised pilot readiness
Pilot readiness is an engineering decision backed by evidence, not a certification claim. The proposed figures below are illustrative acceptance targets for planning a low-speed, supervised programme. A competent safety assessment may require different or substantially stronger limits, and some hazards may prevent the pilot regardless of aggregate model scores.
Table 6. Example pilot release checklist and evidence requirements

The encounter and crop-action counts are test-planning examples, not sufficient proof of safety. Independence, exposure, severity, and statistical uncertainty matter more than a headline count. The approval should identify who can stop a trial, how emerging failures are triaged, and which evidence would justify expanding to a new crop or season.
Case study: Small Robot Company and the Wilma platform
Small Robot Company (SRC) was a British agricultural robotics venture developing an ecosystem in which robots could scan fields, interpret crop conditions, and support targeted, lower-chemical interventions. Its historical Small Robot Company case study is useful because it shows that reliable agricultural automation also needs a scalable geospatial data and operator layer.
Engineering challenge and Spyrosoft’s role
SRC’s concept connected three named robotic platforms – Tom, Dick and Harry – with Wilma, a crop monitoring and care system. Robot-collected high-resolution imagery and AI-generated maps needed to become understandable, actionable information for farmers. Spyrosoft designed and implemented the first prototype of Wilma’s user interface and helped develop its geospatial cloud platform, using a Java back end, React front end and GeoServer.
Commercial reference figures and what they do not prove
Project reference materials describe programme-level indicators of 60% less manual labour during planting and care, up to 30% lower herbicide use and up to 15% crop ROI benefit. These are reported business impact indicators from a historical project reference, not independently audited perception measurements or results attributable solely to the Wilma interface. The published case study does not disclose verified person-detection miss rates, crop-contact rates, stop distances, or BBCH-specific model performance.
That distinction is the core lesson. A robot can produce valuable field maps, a well-designed cloud platform can make them usable, and the entire ecosystem can still require a separate, traceable validation programme for the perception-to-actuation loop. The project provides a relevant software and geospatial engineering reference; it should not be presented as evidence of a certified safety function.
How Spyrosoft supports perception engineering and computer vision for agricultural robots
Spyrosoft brings together computer vision and AI engineering, geospatial platforms, embedded and robotics software, functional safety and AgriTech expertise, and test automation. These capabilities matter because the most difficult field faults often sit at the interfaces: a correctly identified plant with an incorrect location, a timely sensor message arriving late at the controller, or a robust model paired with an untested operator recovery procedure.
Our support for agricultural robots can cover the following work packages, adapted to the machinery OEM’s safety case and product maturity:
- Perception architecture and ODD definition: define hazards, sensor coverage, crop-stage boundaries, processing budgets, and safe operating modes.
- AI and computer vision: build crop–weed classification, segmentation, obstacle detection, tracking, and confidence-monitoring pipelines; design representative datasets and evaluation splits.
- Sensor integration and embedded implementation: align RGB, multispectral, LiDAR, radar, and GNSS/IMU data; address calibration, timestamps, compute limits, and actuator interfaces.
- Functional safety engineering: trace hazardous situations to system requirements, safety-related monitoring, fault reactions, and operator controls without equating a machine-learning metric with safety compliance.
- Automated verification: implement replay, SiL, HiL, fault injection, regression tests, and field telemetry analysis, with traceability from requirement to defect and release decision.
- Geospatial and operational software: connect robot observations to crop maps, work orders, treatment records, fleet supervision, and agronomic systems.
Spyrosoft’s wider Test Centre capability includes more than 65 automated test benches and over 10,000 automated test cases executed weekly in its established testing environment. These are cross-industry capacity indicators, not a claim that a particular agricultural perception system has passed 10,000 safety tests. The benefit for equipment manufacturers is a repeatable, evidence-led process that can shorten defect feedback loops and make field-pilot decisions more transparent.
For targeted spraying, vision evidence can also be connected to prescription maps and a plant protection product search tool, provided the product, crop, label, dose, and treatment conditions are checked separately against applicable rules. Perception software should never be treated as a substitute for that agronomic and regulatory decision.
Planning an agricultural robot pilot? Discuss the operating domain, the sensor stack and the validation evidence you need with Spyrosoft. A useful first engagement is an ODD and perception test-gap assessment, followed by a scoped replay, HiL, or supervised field campaign.
Summary: validating perception and computer vision in agricultural robots
The question is not whether a crop–weed model can achieve a high benchmark score. It is whether the entire perception and agricultural computer vision system can detect relevant hazards early enough, recognise its own limitations, protect crops and people, and provide evidence when the field behaves differently from the training data.
Begin with a bounded ODD; validate sensors and annotations, then measure per-hazard misses, uncertainty, latency, stopping distance, and crop damage. Use replay, simulation, SiL, HiL, and supervised field tests as complementary evidence. Expand to other crops, weather conditions, or BBCH stages only after the evidence supports the change.
Our AgriTech and AI experts can support you in developing and validating perception systems, addressing field-specific challenges, and building more reliable agricultural robotic solutions. If you need help implementing perception validation and computer vision for agricultural robots so that they can better handle unpredictable field conditions, contact us via the form below. Let’s work together to make your agricultural automation safer and more dependable.
References
- Liu, S., Chen, Z., Liu, J., Ling, Z. and Yan, Y. (2026). ‘Reproducible reliability benchmarking for crop–weed visual perception under dataset shift’. Information Processing in Agriculture. DOI: 10.1016/j.inpa.2026.08.007.
- Olsen, A. et al. (2019). ‘DeepWeeds: A multiclass weed species image dataset for deep learning’. Scientific Reports, 9, article 2058. DOI: 10.1038/s41598-018-38343-3. Open-access journal article.
- Kragh, M. F. et al. (2017). ‘FieldSAFE: Dataset for obstacle detection in agriculture’. Sensors, 17(11), article 2579. DOI: 10.3390/s17112579.
FAQ
It may if those conditions are not covered by its validated operating envelope. Ask the supplier for crop-damage and missed-target results split by lighting, wet foliage and BBCH stage, and for evidence that the robot slows or stops when visibility falls below its limits.
A trained object detector can identify known classes, but a safe design must also treat an unrecognised object in the travel or working envelope as a potential obstacle. Request encounter-level detection results and independently verified protective-stop tests, not just a person-detection accuracy percentage.
The machine should monitor sensor health, detect missing or unreliable data, and move to a defined degraded mode. Depending on the risk assessment, that may mean reducing speed, turning off the implement, or making a controlled protective stop; it must not simply continue using an overconfident prediction.
Do not assume so. Crop morphology, row geometry, and BBCH stages alter the image distribution. The manufacturer should show cross-crop validation, state any required recalibration or model update, and clearly list excluded crops and growth stages.
Request field-level records of crop-contact incidents, rejected produce, intervention locations, and operator overrides alongside conventional quality and traceability data. The evidence should link interventions to crop lots without treating improved grading as proof of a safe perception system.
Crop and weed identification does not authorise a chemical treatment. Product selection must remain within applicable label, crop, pest, dose, buffer-zone, and local legal restrictions. A plant protection product search tool can support this workflow, but it is a separate regulatory and agronomic control from vision validation.
Ask for a signed operational design domain, an independent hold-out test report, per-hazard miss rates with confidence intervals, timing and stopping-distance measurements, sensor-fault tests, operator handover procedures, and a supervised trial protocol with explicit stop criteria.


arrow_circle_rightContact us
Let’s discuss how we can help you with your agritech projects

arrow_circle_right Our Articles