A guide to geospatial data analysis, visualisation & mapping


To introduce you to geospatial capabilities, we have prepared a comprehensive article on the ins and outs of geospatial data analysis. In this guide, we cover the geospatial mapping process, the current state of geospatial analysis, and how it can help companies make better decisions and see things from a broader perspective. In addition, we discuss various ways to collect and process geospatial data, as well as techniques for geospatial data visualisation.
What is geospatial data analysis?
Geospatial data analysis allows the exploration and discovery of dependencies and common points between the objects within our modelled environment in geographical space.
The components of the geospatial analysis are used to provide information on the distance between two objects, the shortest route between them, the condition of the area we monitor and the land relief and elevation of the terrain. You can then use this information to create a 2D or 3D model of a certain area.
Geospatial analysis supports the decision-making process in business and in public infrastructure, for example, to check how ambulances move through a city or if they can reach any area within a designated emergency response time.
Due to its flexibility and business value, geospatial analysis can be used in almost any industry and sector, such as logistics and transportation, agriculture, retail or public infrastructure. Read more about the common geospatial analysis use cases.
What are the benefits of using geospatial data analytics?
Making informed decisions
Using geospatial data analysis allows you to see how spatial data changes in space and time, which will – in the long run – help you make better-informed decisions.
Enhancing analytics
Visualising data in reports and analyses for your employees and customers will make them easier to read and understand.
Enabling the green transformation
The geospatial datasets may serve as a starting point for sustainability and the green transformation projects as they can be integrated into different tools, including business intelligence and sales operations products.
Geospatial analysis techniques and tools
Geospatial analysis techniques and tools can be divided into several categories:
Vector & raster processing tools
These include:
- geometrical processing,
- proximity analysis,
- map algebra,
- geostatistical analysis,
- cartographic design tools.
Remote sensing tools that focus on processing satellite imagery or images captured from airplanes.
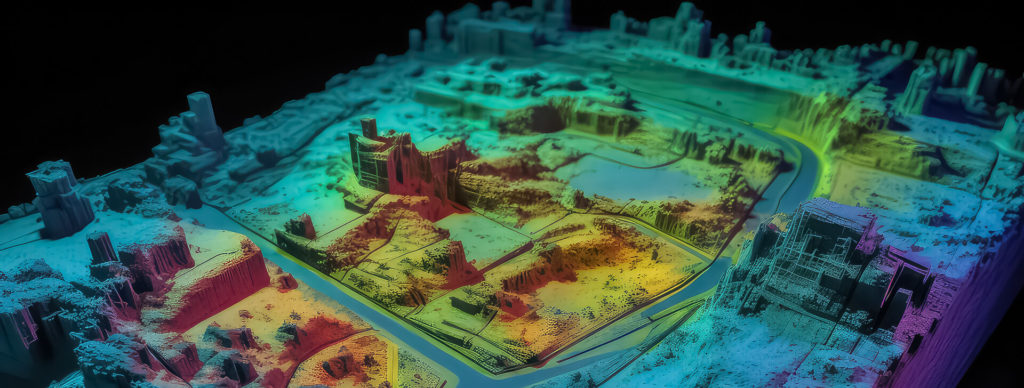
LiDAR – point cloud processing tools used for creating precise numerical models of terrain.
Network models – graphs that are built to complete the distance and directional analyses, including, for example, bus routes, gas pipelines, or water flow through a water supply system.
Check our geospatial services
Learn more
An overview of the most popular geospatial analysis software tools
Businesses that are looking to introduce geospatial analysis products into their projects can now use a vast number of software tools, such as:
GIS (Geographic Information Systems): Esri ArcGIS Desktop, ArcGIS Pro, QGIS (Open-source GIS tool)
Remote sensing: ENVI, SNAP
Spatial ETL (Extract, Transform, Load): FME, Geokettle, Talend
Sharing geospatial data: ArcGIS Server, Geoserver, Mapbox
Spatial databases: PostGIS (spatial extension of PostgreSQL), Oracle Spatial, SpatiaLite
Programming languages: Python – GDAL, Geopandas, Rasterio, Arcpy, OpenLayers, Esri JavaScript API
>> Read about the above tools in more detail in this article: An introduction to geospatial analysis for business
How is the visualisation of geospatial data done?
With big and complex data sets, it’s difficult to draw conclusions by analysing endless tables. Geospatial data visualisation helps tell the story behind the data. There is a growing need to understand how different variables correlate to geographical locations. Without visualising these complex relationships, it’s almost impossible to make meaningful data-driven decisions.
The geospatial data are usually visualised in the form of static or interactive maps. Maps allow context for the data to be created using shapes or colours to reveal patterns and draw focus to specific areas. They help to spot deviations from the norm, problems, and to observe changes and trends. Geospatial data visualisations are also often used to make predictions.
What are the geospatial data visualisation techniques?
The techniques of data visualisation depend on whether it’s raster data or vector data being used. It determines the tools that are used to visualise geospatial data on a map.
Vector data are very detailed graphics that can be zoomed into without losing their sharpness and clarity. In contrast, the level of detail of raster data depends on the resolution. The bigger the resolution, the more detailed the zoomed picture will be.
The below picture illustrates the difference between vector and raster data:
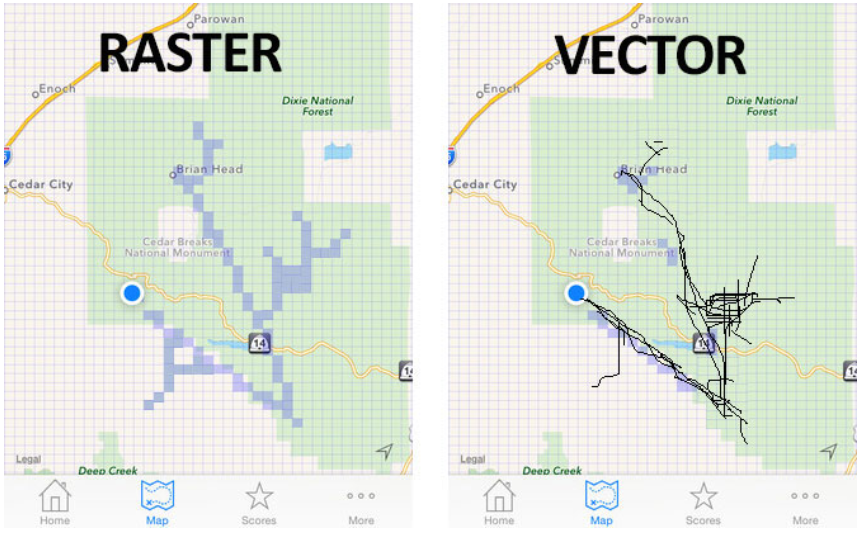
Source: Vector data and raster data comparison – geoawesomeness.com
>> Read more on: How is geospatial data visualisation done?
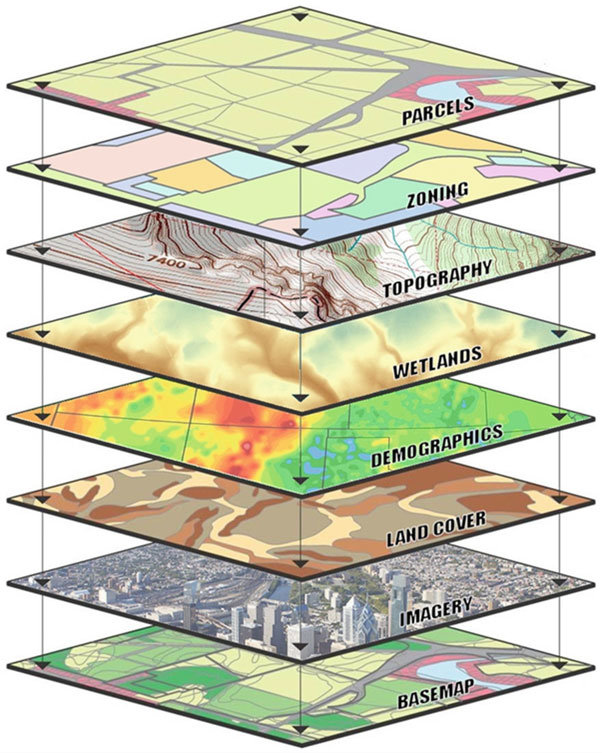
How does geospatial mapping work?
Geospatial mapping consists of building spatial data visualisation layer by layer. An example topographic map is nothing more than the assembly of those. It includes layers of data, graphic layout, and cartographically correct design of a map in a specific order so that, in the end, they constitute one coherent model of space and its final view.
Geospatial mapping can be seen as a process with four stages:
1. Geospatial data acquisition
The first stage requires the collection of primary and secondary data. The sources and type of data vary and depend on the nature of the phenomenon we work with. They can be acquired, as one of many examples, through the collection of geodetic measurements or through aerial, drone or satellite imagery.
Aerial, drone and satellite imagery can be taken with the use of sensors (active or passive) to collect various types of data. Remote sensing can provide us with many kinds of data, such as optical, LiDAR or SAR (Synthetic Aperture Radar) data. They can be captured, for example, in natural colours or infrared.
2. Spatial data management processing and input to databases
The collected geospatial data is processed to feed the relevant databases that store information about the raw geometry of objects without any graphic symbols. Data contained in such databases are then passed on to software programmes responsible for analytical functions. Based on them, we can further process these data and carry out spatial analyses.
3. Creating a model and design
The next stage involves creating designs and graphics for the map. In this process, symbols and colours are assigned according to specific cartographic rules, so that objects or places are as recognisable as possible, and the overall perception is understandable to the average user. Also, at this stage, one of the most important activities in the map-making process takes place, that is, cartographic generalisation.
4. Publication
The last stage is the publication of the prepared product or a model as an exported map or as a map service that can be embedded in a website.
>> Read about the geospatial mapping process in more detail in this article: What is geospatial mapping, and how does it work?
Technologies and tools in geospatial mapping
Geospatial mapping requires the use of certain geospatial technologies to provide data, which can be used in the modelling, analysis, and visualisation of the map. They are also helpful in the case of making decisions based on relevance and priority of resources.
These technologies include: Geographic Information Systems (GIS), GNSS or remote sensing, which we’ve already discussed earlier in this guide.
>> Find out more about emerging trends in geospatial technologies and tech innovations in geospatial software solutions
Where to use geospatial mapping?
Maps are often a background – they provide a graphic context for data visualisation. Organisations and companies throughout the world are applying geospatial mapping for various reasons and in many different ways. Some of them are looking for extra business value, better navigation and planning or benefits for customers and employees.
- Geospatial mapping is commonly used in areas like:
- Changes and updates on maps
- Logistic and route optimisation
- Mapping quantities and densities
- Natural disaster management and prevention
- Military surveillance and defence
- Agriculture and field scanning
- Sustainability and environmental preservation
- Urban planning
>> In this article, you’ll find some examples of geospatial mapping use: How is the visualisation of geospatial data done?
Contact our geospatial software experts
If you need help with the implementation of geospatial data analysis or mapping solutions in your organisation, feel free to reach out to our team via the contact form below or check out our offer.


arrow_circle_rightContact us
Get in touch to check how our experts could support your project

arrow_circle_right Our articles