Qt Quick / QML performance optimisation dos and dont’s
A system is only as strong as its weakest element. Even if most of the codebase is efficient, a single poorly optimised function or inefficient algorithm can drag down the entire system’s performance. This bottleneck can lead to slow response times, increased resource consumption, and degraded user experience. Performance issues often cascade, where one slow component affects others, amplifying the problem. Therefore, developers must focus on optimising every part of the software, ensuring no weak links exist that could undermine the system’s performance and responsiveness.
We often tend to overcomplicate solutions. In the pursuit of elegance, flexibility, or feature richness, developers may introduce unnecessary complexity – such as overly intricate architectures, excessive abstractions, or heavy components. While these solutions might appear sophisticated, they can lead to increased code maintenance, harder debugging, and slower performance due to added overheads.
Simpler, more straightforward approaches are often more efficient and easier to maintain, highlighting the value of clarity and simplicity in software development. That is why I constantly remind myself of a good old acronym, KISS – to keep it stupidly simple. This is a core principle that I would like to instill in any developer.
But what is performance really?
By performance, I mean how efficiently and quickly a software application executes tasks, processes data, and responds to user inputs. High performance is crucial for providing a smooth user experience, especially in applications requiring real-time processing. Rendering techniques play a significant role in performance, particularly in graphics-intensive applications. Efficient rendering ensures that images, animations, and user interfaces are displayed swiftly and smoothly, without lag or delays. Optimising performance in this context involves minimising the computational load, reducing memory usage, and utilising efficient algorithms that can handle complex scenes and interactions without compromising speed or visual quality.
In graphics and rendering, primitives and batching are fundamental concepts that significantly impact performance. Primitives refer to the basic shapes or elements, such as points, lines, and triangles, that are used to construct more complex graphical objects. Batching, on the other hand, is a technique where multiple primitives are grouped and processed in a single operation rather than individually. This reduces the number of draw calls to the GPU, which can be a performance bottleneck in rendering pipelines.
Performance is not only measured by speed and responsiveness but also by memory consumption. Efficient memory usage is critical for ensuring that an application runs smoothly, particularly on devices with limited resources. High memory consumption can lead to slower performance, as the system may need to use disk space for additional memory (through swapping), which is much slower than RAM. Additionally, excessive memory use can cause application crashes or sluggishness, especially when running alongside other programs.
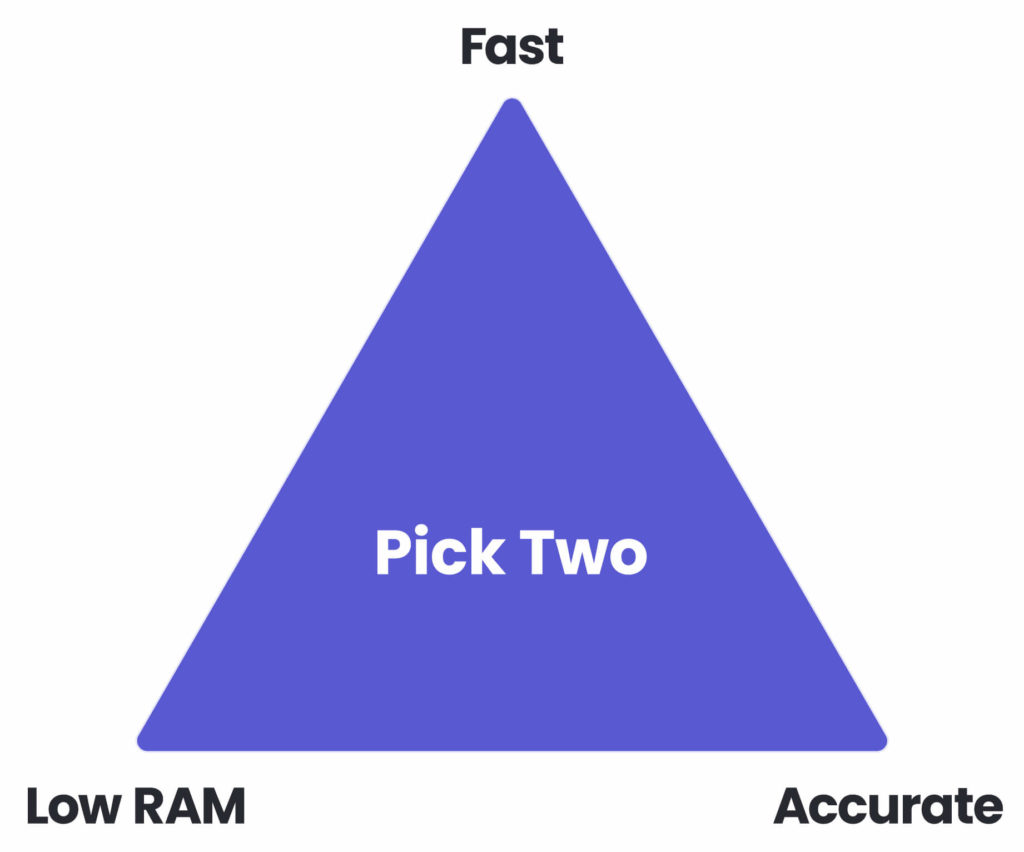
There is often a trade-off between speed and memory, where optimising for one can impact the other. For instance, algorithms can be designed to run faster by using more memory to store precomputed data, caching results, or employing more extensive data structures. This approach reduces the need for repeated calculations, speeding up execution but increasing memory consumption. Conversely, developers can reduce memory usage by using more compact data structures or algorithms, which may require additional computations, thus slowing down the program. Balancing this trade-off is crucial in software development, as the optimal approach depends on the specific requirements and constraints of the application, such as the target platform’s memory capacity and performance expectations.
We shouldn’t forget that increasingly performance has been measured by power consumption, as the market has recognised the critical role of energy efficiency in optimising both the sustainability and operational efficiency of applications, especially for battery-operated devices.
Common performance pitfalls
Using complex solutions
Typically, shader effects are to blame here: blur, opacity, masking, colourise, shadows. Every time anything changes in our scene, Qt Quick has to repaint everything from scratch, including items that have stayed the same. Usually, we need to manually identify which parts of the scene could and should be simplified.
Premature optimisation
Premature optimisation is the practice of focusing on optimising parts of a system before having a clear understanding of where actual performance bottlenecks lie. This approach often leads to wasted effort and complexity, as developers may spend time improving areas of code that have little impact on overall performance.
Not using a profiler
Instead of premature optimisation, it should be guided by profiling and real data, which reveal where the most significant inefficiencies are.
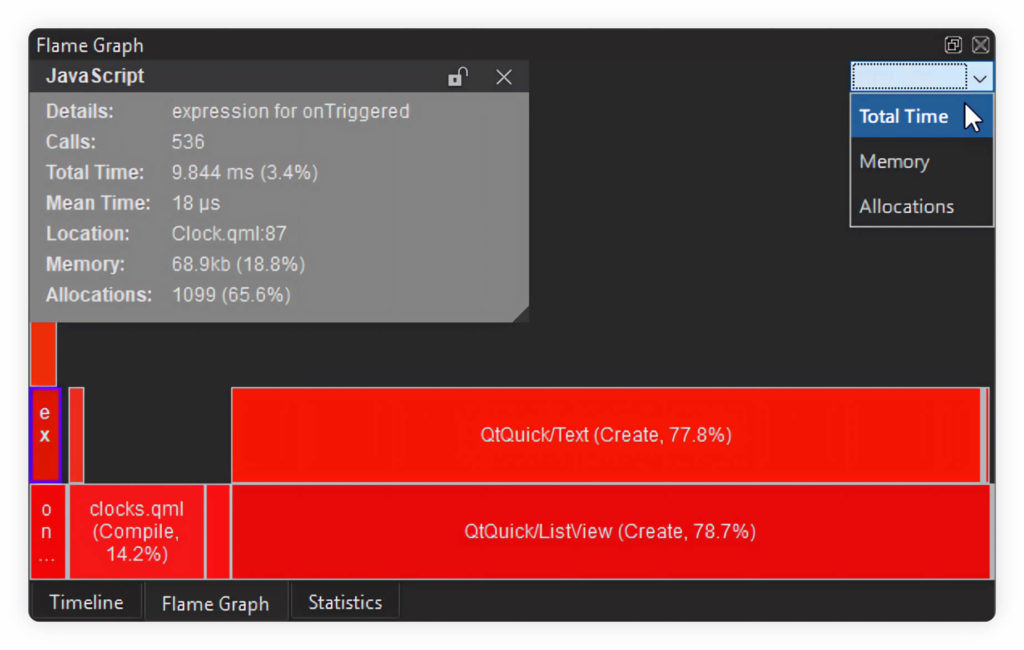
For CPU and RAM memory analysis of QML / JavaScript code, you should use the QML profiler provided with Qt Creator. It does not profile C++ code, though. However, any general-purpose profiler should suffice to analyse C++ code (e.g. Valgrind Callgrind).
For GPU / renderer analysis, you can set specific environment variables to enable Quick Scene Graph rendering statistics – which you will learn later on in this article.
Excessive bindings
Each binding in QML creates an evaluation context that monitors changes in the properties on which it depends. If your application has a large number of bindings, especially on frequently changing properties, this can lead to significant overhead.
Bindings that depend on other bindings can cause a chain reaction where a change in one property triggers updates across multiple bindings. This can result in cascading recomputations even when the underlying property change doesn’t affect the result.
Using bindings extensively within components that are repeated many times (e.g. ListView) can multiply the performance costs. Each repeated item may have its own set of bindings, leading to a large number of simultaneous evaluations. Move complex calculations out of bindings and into functions or properties that are computed only when absolutely necessary. Consider setting properties directly or using minimal bindings for critical properties only.
Overdrawing
The easiest way to be faster is to draw less. Ideally, we would like Qt Quick to draw all and only the elements the user can see. Remember that Qt Quick has to repaint every item with visible property set to true. You should hide obscured items – it can be done seamlessly with views (e.g. StackView).
Works fine on desktop, but fps drops on embedded
Embedded/mobile devices have a subset of hardware acceleration offered by desktops. Always remember to profile and analyse the system on the target device to avoid unpleasant surprises later on.
Not understanding how renderers work
Whether it is OpenGL, Vulkan or Qt Quick Renderer – not being familiar with the general concept of graphics pipeline rendering will backfire on you sooner or later. You don’t need to be an expert in rendering, but having a grasp of how it works under the hood will save you many headaches later on and allow you to squeeze the maximum efficiency out of the graphics chip.
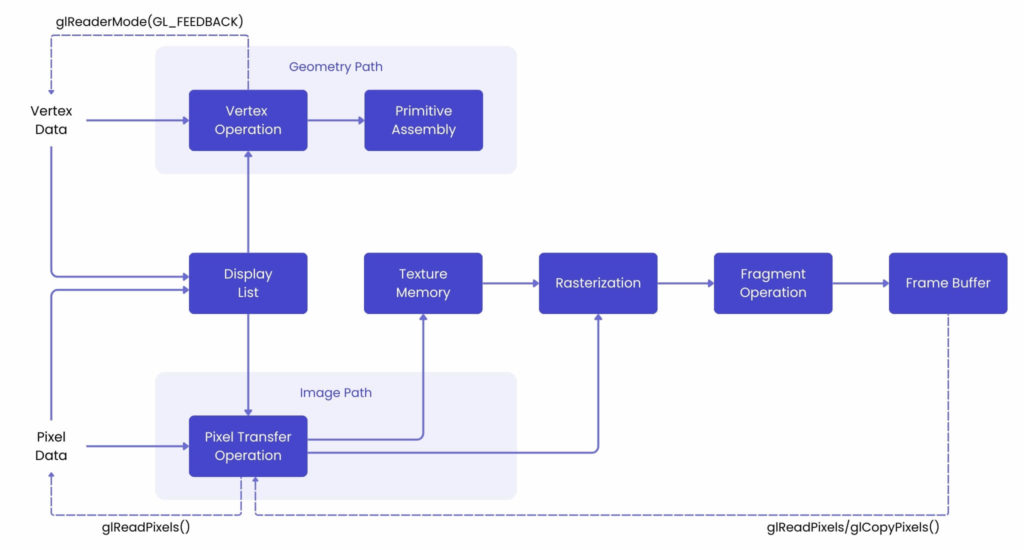
As a general principle, we can say that too many state changes in a pipeline kill its performance. By state changes, we can list any change of textures, buffers, opacity, clipping, shaders, or render targets. Ideally aim to draw as many elements as possible without state changes.
Remember: GPUs are great at drawing a large number of primitives in one go.
That is why using as many primitives as possible is efficient.
Qt Quick Renderer
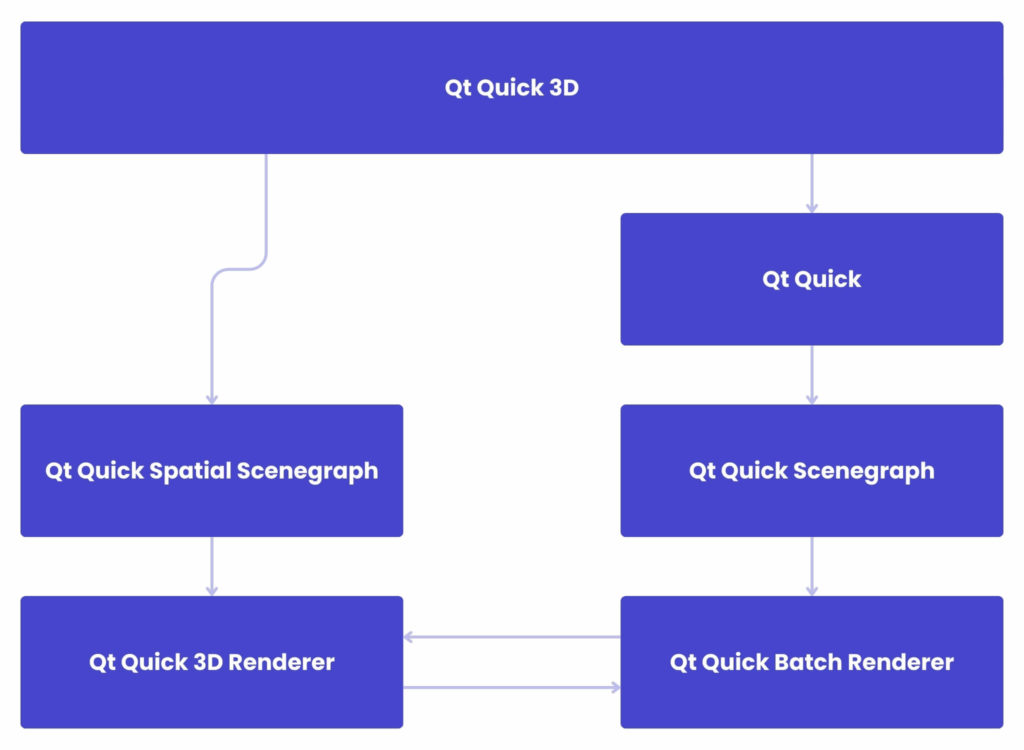
Scene Graph
The Scene Graph is the core data structure used by Qt Quick Renderer to manage and render visual elements. It organises QML items into a tree structure, where each node represents a visual element, such as a rectangle or image. It enables ways to optimise rendering.
Batching
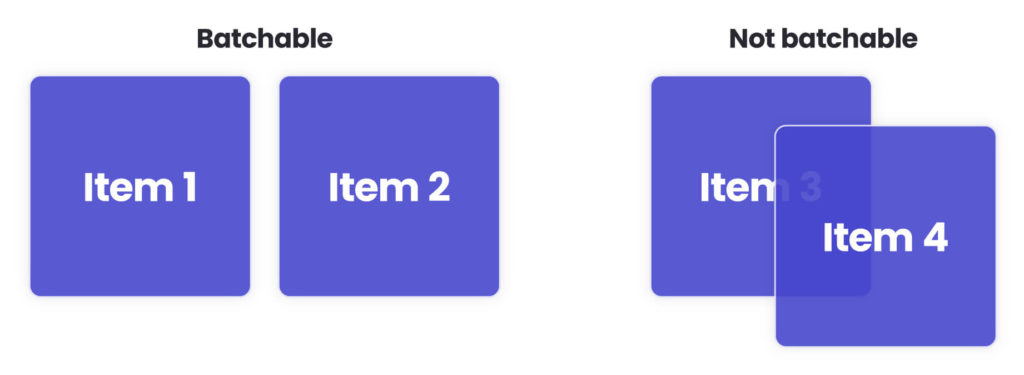
Batching groups multiple rendering commands into a single operation to minimise GPU overhead. Not all rendering commands can be batched – only ones that share the same pipeline state. Imagine that any change of opacity, shader, texture, clipping, or render target results in a new batch (which leads to worse performance).
Batching also uses techniques like texture atlases to reduce the number of texture switches, which helps improve performance. The Image and BorderImage items will use it unless the image is too large.
Good performance comes from effective batching, with as little as possible of the geometry being uploaded again and again.
Opaque primitives
The renderer separates between opaque primitives and primitives which require alpha blending. By looking at each primitive’s material state, the renderer will create opaque batches. The Qt Quick core item set includes rectangular items with opaque colours and fully opaque images, such as JPEGs or BMPs (not PNGs). Another benefit is that opaque primitives do not require GL_BLEND to be enabled, which can be quite costly, especially on mobile and embedded GPUs.
Debugging
By setting the environment variable QSG_RENDERER_DEBUG=render, the renderer will output statistics on how well the batching goes, how many batches are used, which batches are retained and which are opaque and not. When striving for optimal performance, uploads should happen only when really needed, batches should be fewer than 10, and at least 3-4 of them should be opaque.
Setting QSG_VISUALIZE to batches visualises batches in renderer, clip draws red areas to indicate clipping, changes visualises changes by flashing overlay of a random color, overdraw highlights overdraws in 3D.
Case study
A great case study I can present to you in regards of QML performance optimisation is a project task I have done for one of our clients.
The project UI designs were made in Figma, a popular tool to create, share, and test designs for many apps. It comes with plenty of properties to work with. One of them is shadow effects. These drop or inner shadows translate to the box-shadow CSS property.
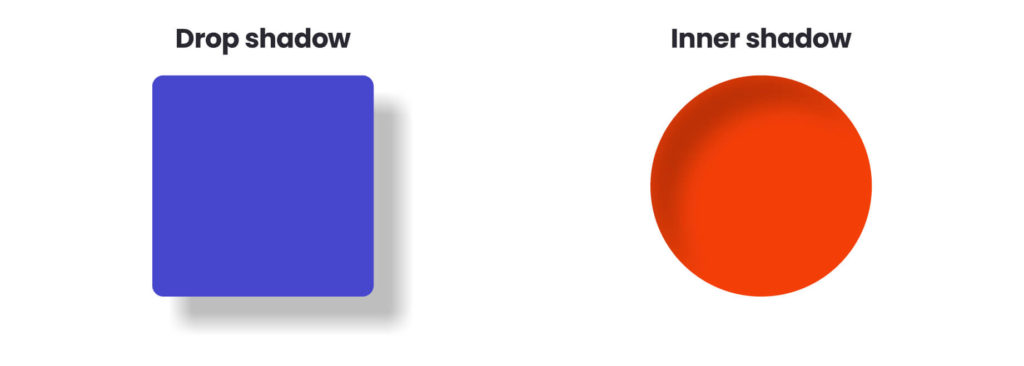
We had to achieve the same effect in QML – and we did.
Our first approach was to use DropShadow component from the Qt’s Graphical Effects module. The visual result was great, but performance hit on the target embedded device was huge.
As a second approach, we tried a custom-tailored shader. It produced a very nice effect, with an acceptable performance hit. But as the system grew up, more and more elements were using this shader, making the performance hit less acceptable.
An item using a layer/shader cannot be batched during rendering. And that was the culprit of our bottleneck. I have decided that we need to trade one-to-one accuracy with Figma for a good enough but fast and memory-efficient solution.
Since I had game-dev experience, I knew the concept of 9-slice scaling well.
It is a technique to create scalable images that can be resized without distorting the important parts of the image (corners). Luckily Qt Quick provides BorderImage component that implements this technique.
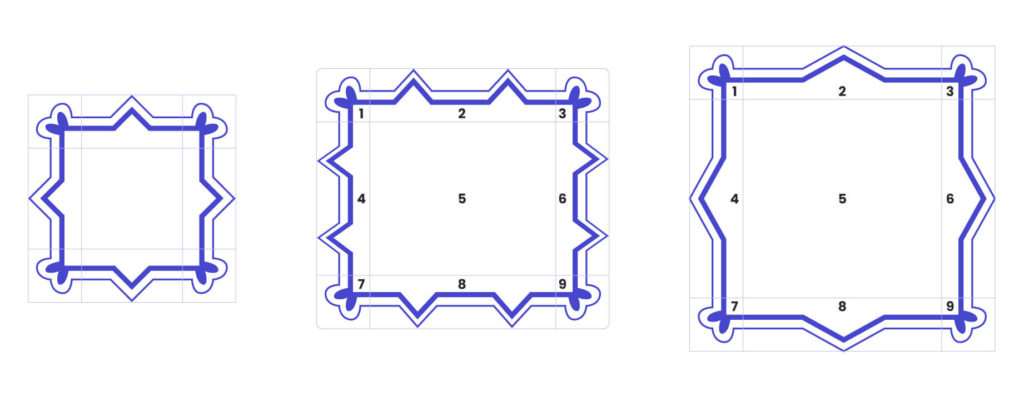
I did request 9-slice images of pre-rendered shadows from our designers, which was not a big hassle for them since Adobe Photoshop (and many other tools) offers 9-slice editor plugins to create such assets easily.
I quickly replaced the shader approach with a border image in our box shadow implementation and a miracle happened: fps was tripled, up to 60 fps from 20 fps. Even memory consumption was halved, down to 600 mb from 1200 mb. Since each item using shadow was rendered to a separate layer/buffer, the memory footprint for such an implementation was quite huge.
Of course, the border image approach was a trade-off for accuracy. But it was no surprise that everybody noticed much better performance. The visual quality degradation of the shadow effect was, in fact, negligible, especially compared to the performance gain we achieved.
Often, perfection is the enemy of good.
Summary
There’s no single remedy for performance issues. Every application and scenario is different, requiring tailored approaches to optimisation.
Simplicity leads to better performance, easier maintenance, and fewer bugs – but it comes from experience and expertise.
Experience plays a vital role in making these decisions – seasoned developers can identify potential pitfalls, choose the right tools, and balance trade-offs effectively, ensuring that the solution is not just functional but also efficient and maintainable.
About the author
Need support with a Qt-based application? Our team is ready to help
RECOMMENDED ARTICLES


