The power of geospatial data visualisation

Recently, I had the pleasure of attending two amazing geospatial events: the Esri UK Annual Conference 2023 and the brilliant GEO Business exhibition. The Esri UK Conference was a formidable showcase of technology demos and innovation from the industry. At the GEO Business exhibition, the great and good of the geospatial world came together to network, discuss technology, and look to the future. It was amazing to be able to meet up with like-minded people who have incredible goals and staggering problems to solve!
The geospatial industry is playing an increasingly pivotal role in shaping our world. It is a huge part of daily life – from urbanplanning and environmental management to disaster response and navigation systems. There are very few industries that aren’t touched by geospatial in some way.
I’m fascinated by the exponential growth of geospatial data and technology. It has definitely opened new frontiers and as a result empowers businesses, governments, and individuals to make informed decisions.
One growing area of geospatial, which I often find myself discussing with clients, is data visualisation. This refers to maps, charts, graphs, and interactive visualisations. Software is critical to this. Complex data is turned into something manageable, understandable, and visually appealing. There’s a huge requirement for technology service providers to step into this space. With cutting-edge software, professionals in this field can derive valuable insights, make informed decisions, and solve important challenges.
Geospatial data visualisation: how it revolutionises data interpretation and decision making
The following points refer to just a few of the ways in which we can interpret and use the location, or spatial data that’s gathered:
Enhanced understanding
Geospatial data visualisation allows users to comprehend large volumes of complex data more effectively. This helps the user to identify patterns and trends more easily.
Interactive exploration
Interactive visualisations enable dynamic exploration of data. Being able to pan and zoom through data and layers, interacting with data points makes data much richer. This makes data more tactile.
Effective communication
Visualisations makes it simpler to communicate ideas and data to diverse audiences. Complex relationships between data can be shown in a much more compelling way – allowing you to get people on board with ideas.
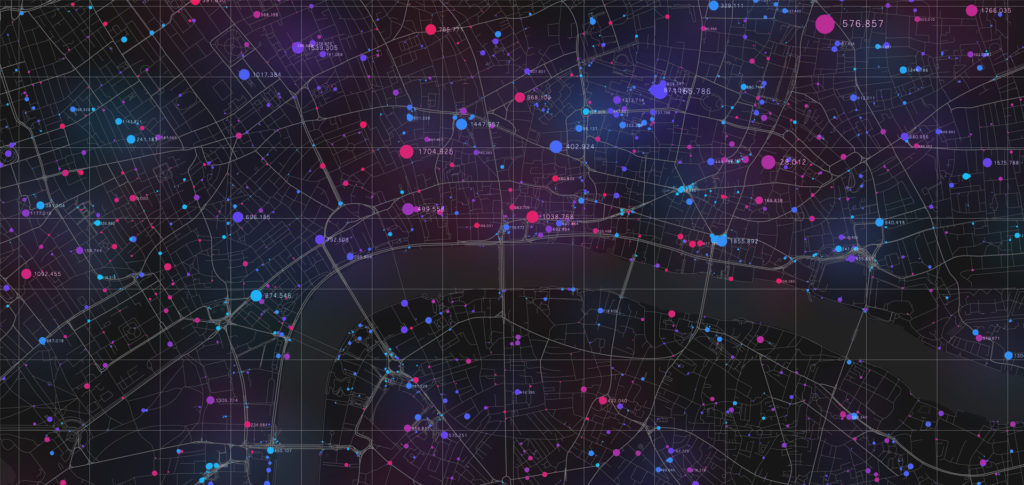
Hotspots and clusters
Visualisation enables users to spot patterns and hotspots. An example of this being used in a critical function is in crime intelligence. It highlights the relationship between different datasets.
These benefits make geospatial data visualisations invaluable in various domains, helping stakeholders derive insights and make informed decisions.
Do you have a need for geospatial data visualisation?
Our expansion in the field of geospatial continues. With several clients in the space and more partnerships in the pipeline, we position ourselves as the ‘go-to’ technology services provider for the industry. I’m personally very passionate about geospatial – the potential is vast, and I’ve seen some amazing innovation during my career.
>> To learn more about what a partnership with Spyrosoft looks like, download our free ebook
Software is at the heart of every geospatial breakthrough, enabling us to capture, analyse, and visualise complex spatial data like never before.
As always, we’re proud to be able to offer our extensive services to businesses in the space. Contact us directly via the form below to discuss your needs.


arrow_circle_rightContact us