Collecting data alone isn’t enough – what matters is how you use it


Although chemical plants now collect more production data than ever before, teams still rely on spreadsheets, exports and manual investigations when something goes wrong. The problem isn’t a lack of data, but rather the gaps between the systems.
At Spyrosoft, our teams specialise in solving these kinds of challenges. Through our expertise in AI for the chemical industry and plant operations, we develop solutions that integrate production systems, industrial IoT and AI. This helps to transform complex operational data into actionable information.
We spoke to Lukasz Piszczek, Director of the Chemicals Business Unit at Spyrosoft, about our approach to these challenges and the ways in which data engineering, industrial IoT and AI can transform chemical plant operations.
Why is manufacturing data so hard to use?
A mid-sized chemical plant generates millions of sensor readings every day. These include reactor temperatures every second, agitator loads, jacket pressures and valve positions. On top of that, there are the batch start and stop times, operator notes, lab results, raw material lots and maintenance history. Storage costs almost nothing nowadays, so nearly all of this data is kept, and most sites haven’t had to make hard decisions about what to discard in years.
Then a batch fails and the question that should take an hour takes two weeks. What was different this time?
The answer is almost always in data that the plant already owns. However, it is scattered across five systems that were never designed to be read together.
Five systems = five versions of the truth?
At the heart of it all is the historian, PI or whatever the site standardised on twenty years ago. It records all the data measured by the control systems, at a rate of thousands of readings per second, and can store a decade’s worth of data on a single server without issue. It is the richest dataset in the plant, yet also the least used in most of the plants I have seen. The reason is almost comically mundane. Each reading is filed under a short technical code for the instrument that produced it, but that code provides no information about the product, batch or stage of the process at the time the reading was taken. It is a perfect record of what happened, but not what it was happening to.
One level up is the Manufacturing execution system, which holds the batch record and knows which recipe ran on which line, when it started and stopped, who was on shift and whatever deviations were logged. Many sites don’t use an MES at all, instead keeping the same record in Excel or on paper batch sheets that are scanned at the end of the month.
The LIMS covers the laboratory side of things – viscosity, acid value, solids and colour. Each result is tied to a sample and entered sometime after the sample was drawn. This time lag is more significant than people realise because usually only the entry time survives.
The ERP system is the commercial backbone – managing processes orders, raw materials lots, suppliers and costs. Its batch numbers almost never match the ones in the MES. Nobody planned for that. This is simply what happens when two systems are configured four years apart by different people, each of whom is solving their own problem properly.
The maintenance system keeps track of what has been rebuilt, replaced or cleaned, and when. It tends to be the last system anyone thinks to open, but it often holds the answer.
Five vendors, five databases, five ways of writing a timestamp. No field links a record in one to a record in another, and nearly every question worth asking spans all five. Nothing is missing – it’s just that nothing is joined.
Why does it take two weeks to answer a simple question?
What follows is a composite, weaving together details from several sites into one story without inventing events for dramatic effect. A specialty resin producer runs three batch reactors and produces around forty products. When a long-oil alkyd comes off above its viscosity limit with delivery due in five days, problems arise. A quality engineer retrieves 14 hours of historian data, 90,000 rows of temperature, agitator load and condenser duty, but must first reconcile UTC historian timestamps with local batch records following a time change.
The batch record shows an extended hold without a precise time, the lab results show entry times rather than sample times and the ERP and MES batch numbers require manual mapping in order to trace the new fatty acid supplier across other batches. Ten working days later, evidence suggests that the issue lies with the process rather than the raw material. A partially closed steam valve meant that the reactor took 25 minutes longer to reach reaction temperature, which extended the time in the reaction range and ultimately pushed viscosity over the limit. The batch is reworked and shipped late, while the real cost is ten days of engineering time, reactor capacity, utilities, materials, and customer disruption. However, the most valuable output, the corrected timestamps, system mappings and joined historian, batch and lab data, is deleted, meaning the next investigation must start from scratch.
So, what does a manufacturing data layer actually do?
It is a set of continuous pipelines and a shared data model. Data streams from historians and devices, while batch, quality and order data come from MES, lab systems and ERP without altering the source systems. The hard part is providing context – converting a temperature reading into the jacket temperature of this vessel running this batch at this stage using these material lots. This context is added as the data arrives, with late lab results being linked back to the correct batch, and timestamps, units and system IDs being reconciled automatically. Only then does the data become useful. A reading can be compared with the plant’s best historical runs, deviations can trigger warnings and failed batches can be analysed systematically. While the models may get the attention, it is the underlying infrastructure that determines whether their output is actually valuable.
What if we run the same Thursday again, this time with the layer in place, to see if that makes a difference?
In this case, the engineer opens a view of the entire batch, stage by stage, and compares it with the reference profile for that product. The slow heat-up is immediately visible, twenty-five minutes off profile. The material history is already attached, including information on the new supplier’s lot, the first use and the two sibling batches, both of which are within specification. The maintenance entry on the steam valve is also visible on the same timeline. What would have taken two weeks now takes an afternoon, and most of that time is spent deciding what to do about the valve rather than finding it.
Even better, the same layer can be used to score the batch while it is running. The ramp deviates from the reference two hours into the cooking process, which is long before the final sample is drawn. This gives us enough time to adjust the steam, extend a hold or, at worst, stop feeding good raw material into a batch that is already lost. ‘What happened?’ becomes ‘What do we change right now?’ This compounds over a year, and it compounds in areas that the plant already measures, investigations that used to take days, scrapped against recoverable batches, and drifting yield that nobody can explain.
Some manufacturers develop this in-house, and with a strong data engineering team, a patient sponsor, and a year or more of funding, it can absolutely be done. The failure mode is well documented: the budget is spent on connectors, a lake fills with context-free data, the context model is never built; and the plant ends up with its old silos copied into newer storage.
The alternative is starting from a platform that has already made those mistakes – that is the problem we built PlantOps around at Spyrosoft.
Meet PlantOps, an AI-driven operational efficiency for chemical manufacturing
PlantOps is an AI-powered manufacturing platform which integrates data from various existing plant systems, including MES, LIMS, ERP, SCADA and CMMS/EAM. Using AI and machine learning, it analyses production data to identify patterns and deviations, supporting predictive quality control, optimisation, and root-cause analysis. PlantOps enables manufacturers to enhance production consistency, quality, operational efficiency and decision-making processes, all while retaining their existing systems.
Before implementing PlantOps, we follow a structured process to gain an understanding of the plant’s operational environment and identify the areas with the greatest potential for improvement. This begins with an audit and an assessment of the site’s readiness for advanced analytics. Wherever possible, we visit the factory to observe the production line first-hand, meet the staff and familiarise ourselves with the plant’s specific processes and culture.
Once we have a clear picture of the operational challenges, we analyse the available data to evaluate its quality, completeness, and suitability for advanced analytics. Depending on our findings, the implementation roadmap may involve filling data gaps, integrating existing systems, or replacing selected components, before moving on to the PlantOps deployment. This approach ensures that the solution addresses the plant’s actual needs rather than introducing technology without first understanding the problem it is meant to solve.
The platform typically enables:
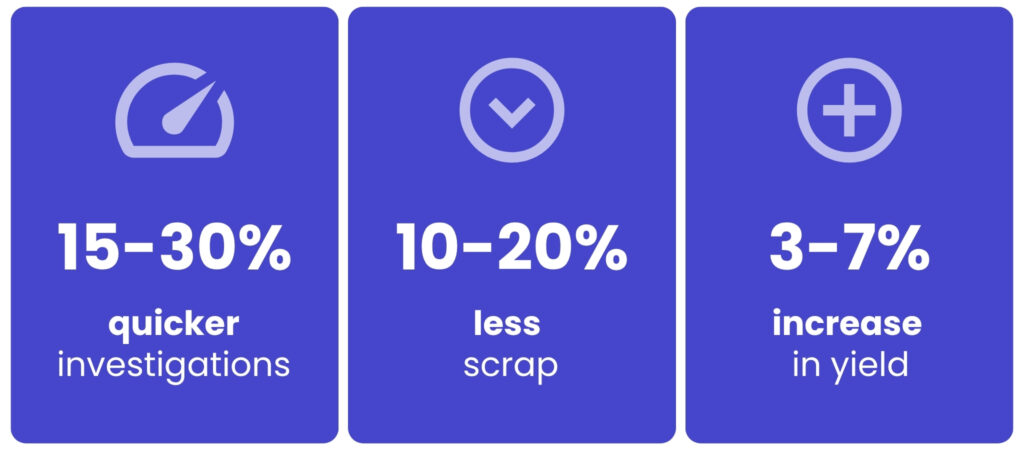
These are indicative ranges rather than guarantees, as the results depend on the amount of process variability visible in the data that a plant already collects. The mechanism is consistent, deviations can be identified mid-batch rather than at the laboratory bench, questions such as whether a new supplier’s batch behaves differently, which production line is best for a particular product, and why one shift achieves better yields can be answered quickly using existing production data.
The connectivity is in place, the process-context model is ready to be mapped onto a plant rather than being invented for it, and golden-batch analysis and predictive quality run on top of it. It can be used on-premises, in a hybrid environment or at the edge, alongside existing control systems rather than in place of them, because in this industry, that is usually the only version that will be approved. The first deployment, which is scoped to one line and one important question, takes about fourteen weeks rather than years. The payback period we quote is three to nine months after going live, mostly coming out of scrap and yield rather than headcount.
Over to you
This is the kind of problem we work on at Spyrosoft – taking complex industrial environments, connecting the data that already exists, and turning it into something that can make a measurable difference on the plant floor.
PlantOps is an example of what can be achieved when data engineering, industrial IoT, AI, and deep manufacturing expertise are brought together to solve a real operational problem. Our goal is to help manufacturers understand what is happening, act faster, and make better decisions.
There are plenty more problems like this to solve, so if you want to work on projects where software, data and AI have a tangible impact on how industries operate, join our Spyrosoft team. You’ll have the opportunity to work alongside technology and industry specialists, solving complex problems for companies where the results matter.
Browse our current job openings and find your next challenge with us.


arrow_circle_rightCONTACT US
Let’s get in touch to see the potential in your production data company

arrow_circle_right Other articles