Why circular agriculture is a data problem before it becomes a waste problem

Circular agriculture needs more than an outlet for unwanted material. It needs reliable information about what exists, where it comes from, its condition, and the options still available. This article proposes five connected layers – Measure, Identify, Connect, Decide, and Prove – for turning farm, processing, and supply-chain data into practical decisions. It explains how to distinguish food-loss prevention from biowaste recovery, where software can help, and how to test the business case without confusing illustrative targets with verified results.
The missing information behind the waste stream
Most agricultural businesses already know several possible uses for their waste streams. The harder question is whether they know exactly how much material they generate, where it originates, what it contains, what it is worth, and where it could be reused.
A rejected load of apples illustrates the difference. Fruit outside a retailer’s size specification, fruit damaged during handling, and fruit affected by a safety issue cannot be treated as one interchangeable category. Yet a record labelled “organic material waste” tells a planner almost nothing about what options remain available.
By the time somebody reconciles the weighbridge ticket, laboratory result, and customer specification, a potential food-processing opportunity may have disappeared. The physical material has deteriorated while the information needed to act has remained disconnected.
The argument is not that every waste problem can be solved with software. Storage, processing capacity, agronomy, safety expertise, and viable buyers remain essential. However, data matters because it helps a business identify the right intervention before those options close.
What the evidence tells us about waste management – and what it does not
UNEP’s Food Waste Index Report 2024 estimated that 1.05 billion tonnes of food waste were generated in 2022 across households, food service, and retail, including associated inedible parts. This represented approximately 19% of food available to consumers. These are downstream global estimates, not a waste rate for farms or processing plants. They cannot be applied directly to an individual business.
Vahdanjoo, Sørensen and Nørremark’s 2025 review of digital transformation in agri-food identifies interoperability, data sharing, and user adoption as important requirements for connected, sustainable farming systems. It supports a systems approach rather than investment in isolated technologies; it does not establish a universal percentage reduction in waste from digitalisation.
The practical distinction is between preventing a loss and recovering value after a loss. A higher recycling rate can coexist with rising food losses. A circular agriculture programme should therefore ask two separate questions: how much food stayed in the food chain, and what happened to the material that did not?
This extends the integration challenge explored in Spyrosoft’s analysis of fragmented data in food processing. In this instance, the objective is to make that information useful while an operational decision can still change the outcome.
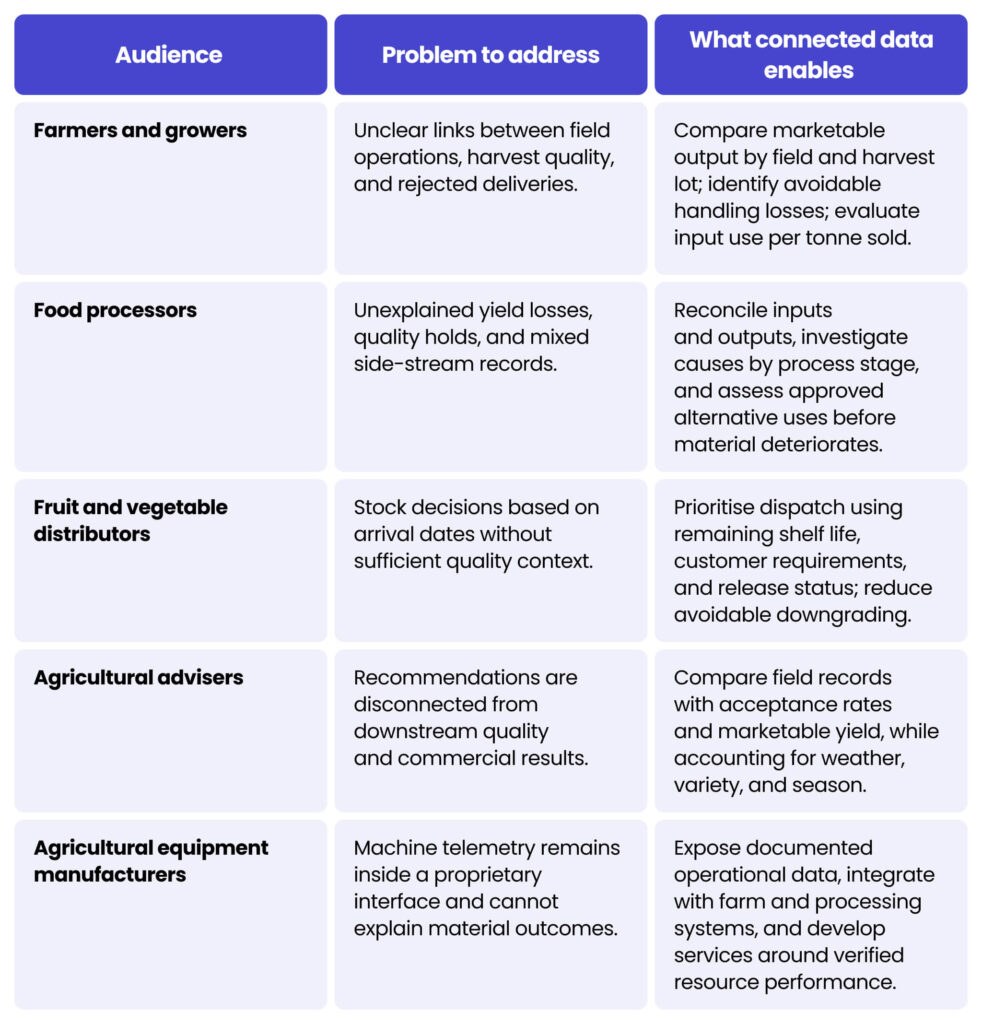
Who benefits from connected circular agriculture data?
The same batch can pass through several organisations, but each needs a different decision from its data. The following applications describe intended benefits to validate in a pilot, not guaranteed outcomes.
Table 1. Problems and practical benefits across the agri-food value chain
Five data layers for circular agricultural practices
Measure → Identify → Connect → Decide → Prove. This is a proposed implementation framework, not a certification standard. Each layer should answer an operational question and give someone responsibility for acting on the answer.
1. Measure: how much material and resource use can we account for?
Start at the points where material changes hands or changes form: intake, sorting, processing, storage, and dispatch. Weighing systems, flow meters, machine telemetry, and production records can contribute, but they do not measure the same thing.
Record net mass separately from packaging and tare. Preserve units, timestamps, measurement method, and equipment identity. Mark estimates as estimates: a machine’s operating hours do not become a measured mass of material simply because both appear on a dashboard.
A useful reconciliation for a defined process and period is:
Opening stock + inputs = food outputs + non-food outputs + disposal + accounted process losses + closing stock + unexplained difference.
Inputs must include relevant additions, such as process water. Evaporation and moisture changes must be accounted for where material is dried or concentrated. Otherwise, a mass difference can be mislabelled as food waste.
Begin with a manageable scope: one crop, one line and clearly defined measurement points. The initial objective is a defensible baseline, including what remains uncertain, rather than a sensor on every asset.
2. Identify: which material are we deciding about?
A weight without an identity is useful for invoicing but weak for prevention. Link the material to its supplier, field or production origin, harvest or production time, batch, and relevant process events.
Preserve parent–child relationships when a lot is split, mixed, repacked, or transformed. A processing run may create food products, recoverable side-streams, and disposal material; each output needs a link to its inputs and its own status.
Separate a commercial rejection reason from a safety hold. “Wrong size”, “late delivery” and “contamination suspected” should not collapse into one code. Keep laboratory results, sampling dates, acceptance criteria, and release decisions attached to the relevant material.
At farm level, this can include treatment records entered through a crop protection product browser and linked to the field and harvest. Such records provide traceability context; they do not replace residue testing or a qualified release decision.
For each side-stream, define a minimum record: quantity, composition where relevant, origin, location, availability window, quality status, intended destination, and responsible owner. Material with unknown status should remain visibly unknown, not silently become “available for reuse”.
3. Connect: can existing systems exchange the same operational facts?
In a typical integration design, ERP owns commercial transactions; MES records production transformations; WMS tracks stock movements; LIMS manages laboratory evidence; FMS contributes field and harvest context; and IoT systems record conditions and equipment behaviour. Not every business needs all six systems – the requirement is continuity of information across the tools it actually uses.
Define shared meanings for batches, quantities, locations, and statuses while preserving source identifiers. Assign an authoritative owner to each field. An analytical platform should not accidentally become a second system issuing conflicting quality releases.
Interfaces should handle duplicate events, corrections, and delayed uploads. Use source timestamps, stable event identifiers, and controlled replay after a connectivity outage. Test what happens when a laboratory correction arrives after a planner has already seen the original result.
This builds on Spyrosoft’s approach to food processing system integration: connect existing applications through governed interfaces rather than replacing them indiscriminately.
Sharing also needs boundaries. A grower may provide the evidence required for a batch decision without disclosing unrelated commercial records. Agree access rights, permitted uses, retention and correction responsibilities before connecting organisations.
4. Decide: which feasible action preserves the most value?
Before asking an algorithm to recommend an outlet, establish which outlets are acceptable. Safety, material suitability, recipient acceptance, and applicable requirements are constraints, not variables to trade against a higher selling price.
For an eligible lot, compare options such as preventing a handling loss, changing dispatch priority, using another food-processing route or arranging an approved non-food outlet. Include the time available, transport, handling, treatment costs, and a confirmed recipient.
Biowaste recycling needs more detail than “tonnes available”. A digestion operator may need dry matter, composition, and contamination information. Compost use needs appropriate quality and application evidence. A potential animal-feed route needs its own suitability assessment. Crop residues may also have an agronomic role on the originating field, so removal is not automatically the preferred option.
AI can support forecasting, anomaly detection, and prioritisation once the input data and validation criteria are adequate. Start with transparent rules where they are sufficient. Test models against a baseline, record uncertainty, and keep accountable people in control of material release and destination approval.
A marketplace can introduce a buyer. It does not, by itself, establish that a particular batch is suitable, that collection will happen in time, or that the transaction has a positive net value.
5. Prove: did the intervention improve the outcome?
A collection ticket confirms a movement. It does not necessarily prove the final use of the material, the prevention of a food loss, or an environmental benefit.
Maintain separate indicators for food retained in the food chain, material sent to non-food uses, disposal, and verified resource recovery. Report both absolute quantities and intensities, such as kilograms removed from the food chain per tonne received. State the boundaries and classification used.
Environmental accounting requires additional care. Wang and colleagues’ 2025 study synthesised field-based evidence and reported emissions reductions of approximately 1 tonne of CO₂-equivalent per tonne of food waste recycled through the assessed composting, anaerobic digestion, and re-feed routes, compared with landfill. This is a research benchmark across studied conditions, not a universal conversion factor for a packhouse.
For a project-specific claim, document the actual baseline destination, transport, treatment, energy use, displaced products, and calculation method. Keep avoided-emissions estimates separate from an organisation’s emissions inventory rather than automatically subtracting them.
The evidence chain should connect the measurement, material identity, decision, recipient confirmation, and calculation version. For a nutrient-return loop, it should also connect recovered material with its confirmed application and agronomic assessment.
Seven high-value applications for more sustainable agriculture
These are candidate applications for prioritisation, not a universal ranking. Start where a material flow is significant, an intervention is feasible, and results can be measured.
Table 2. Seven applications and the indicators to test
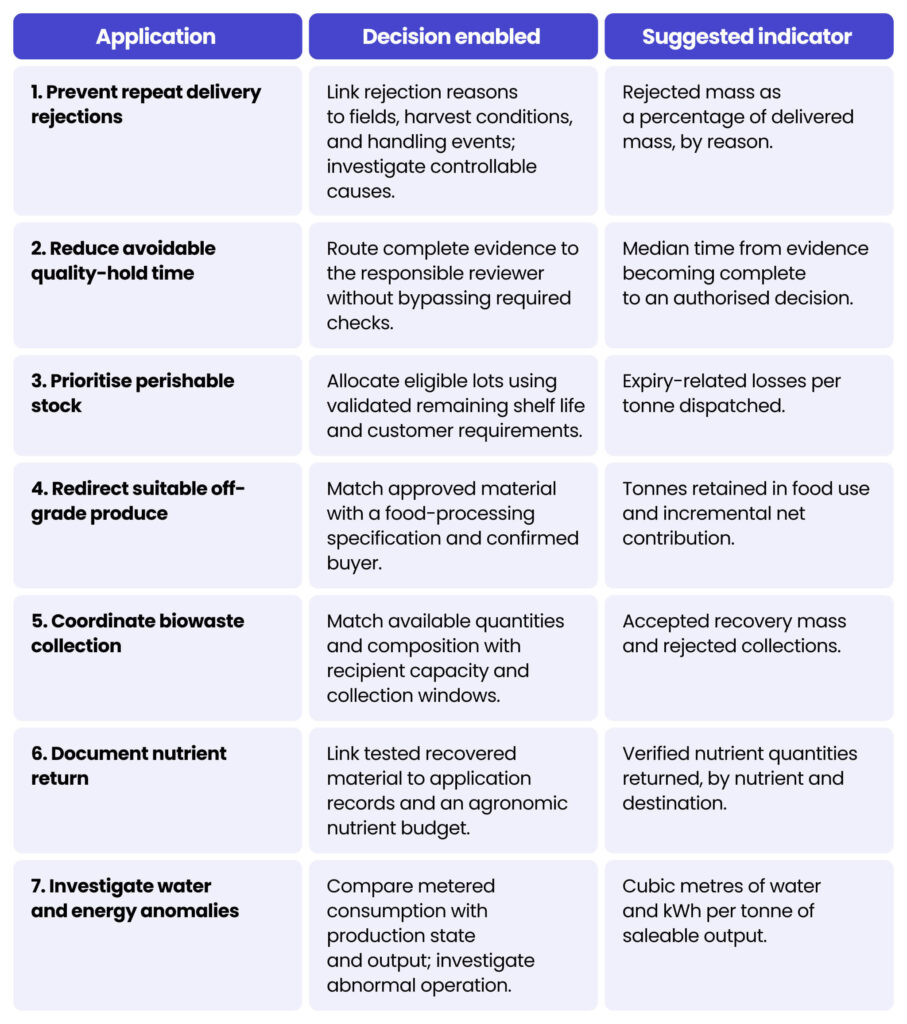
These indicators are deliberately different. Keeping produce in food use is not the same outcome as recovering nutrients, and improving an intensity measure does not necessarily reduce total consumption.
Engineering example: connecting field decisions with execution
Spyrosoft’s project materials describe work on the integration architecture and execution layer connecting automated steering and navigation systems with FarmCloud – the digital infrastructure platform for agri-food companies.
The scope included variable-rate application maps, over-the-air prescription transfer, ISO-XML task exchange, and machine-track and operational telemetry recording. The project materials report more than 3,000 integrated devices and over 700,000 events processed daily.
The relevance to circular agriculture is the engineering pattern: a decision generated in a management system can be linked to execution data from equipment. That pattern is useful for evaluating resource use and checking what actually happened in the field and across the entire supply chain.
These are reported integration-scale indicators, not evidence of a measured food-waste reduction. FarmCloud is Agri Solutions’ platform; Spyrosoft’s contribution described here concerns integration architecture and execution.
Project source: Spyrosoft – Farm Management System integration case. Figures are reported in the supplied project material; no independent before-and-after waste assessment is provided.
Use case: a modelled fruit packhouse business case
Illustrative scenario based on the prior experience, not a reported client implementation.
Consider an apple packhouse receiving 20,000 tonnes during one annual campaign. The example uses assumed operating figures to demonstrate the measurement and financial logic. It is neither an industry-average benchmark nor a Spyrosoft quotation.
The packhouse sells fresh fruit, supplies food processors and sends unsuitable material to approved non-food recovery or disposal. Intake weights, sorting results, laboratory decisions, and dispatch records exist, but are not consistently joined by batch.
The proposed intervention connects those records, captures rejection reasons, flags eligible lots approaching an action deadline and records recipient acceptance. Operational changes accompany the software: revised handling practices, clear review responsibilities, and confirmed alternative buyers.
Table 3. Illustrative annual material balance before and after intervention
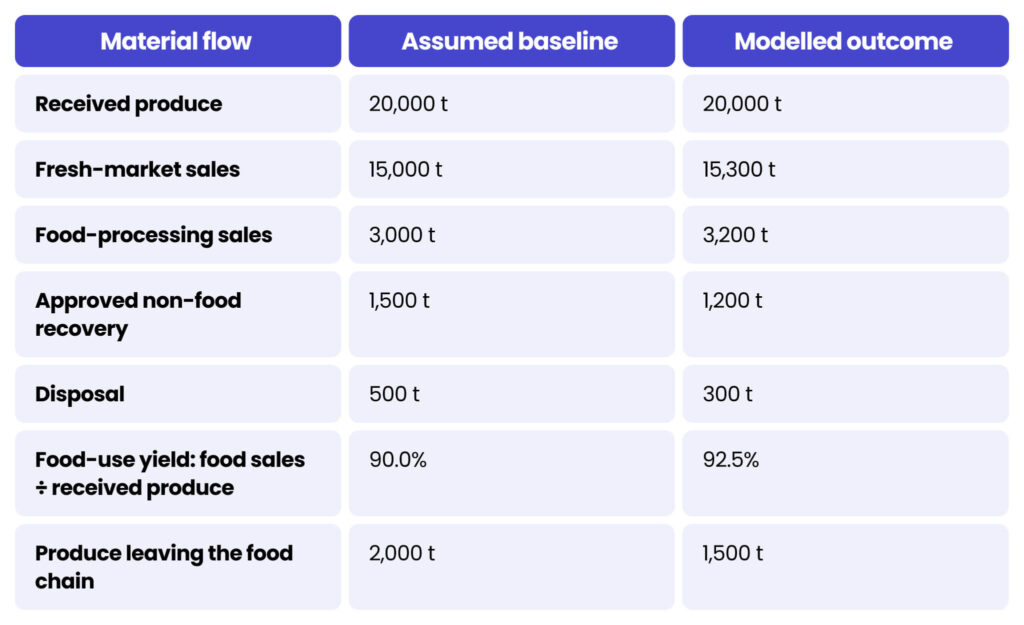
The simplified balance excludes packaging and assumes no stock change, moisture change, or other unmeasured flow. A real installation must reconcile those factors rather than force the totals to match.
The model retains an additional 500 tonnes in food use. Food-use yield improves by 2.5 percentage points, and produce leaving the food chain falls by 25% relative to the baseline. Disposal falls by 40%. The reduction in non-food recovery is not a failure: more material is sold as food instead.
Table 4. Illustrative financial assumptions and simple payback
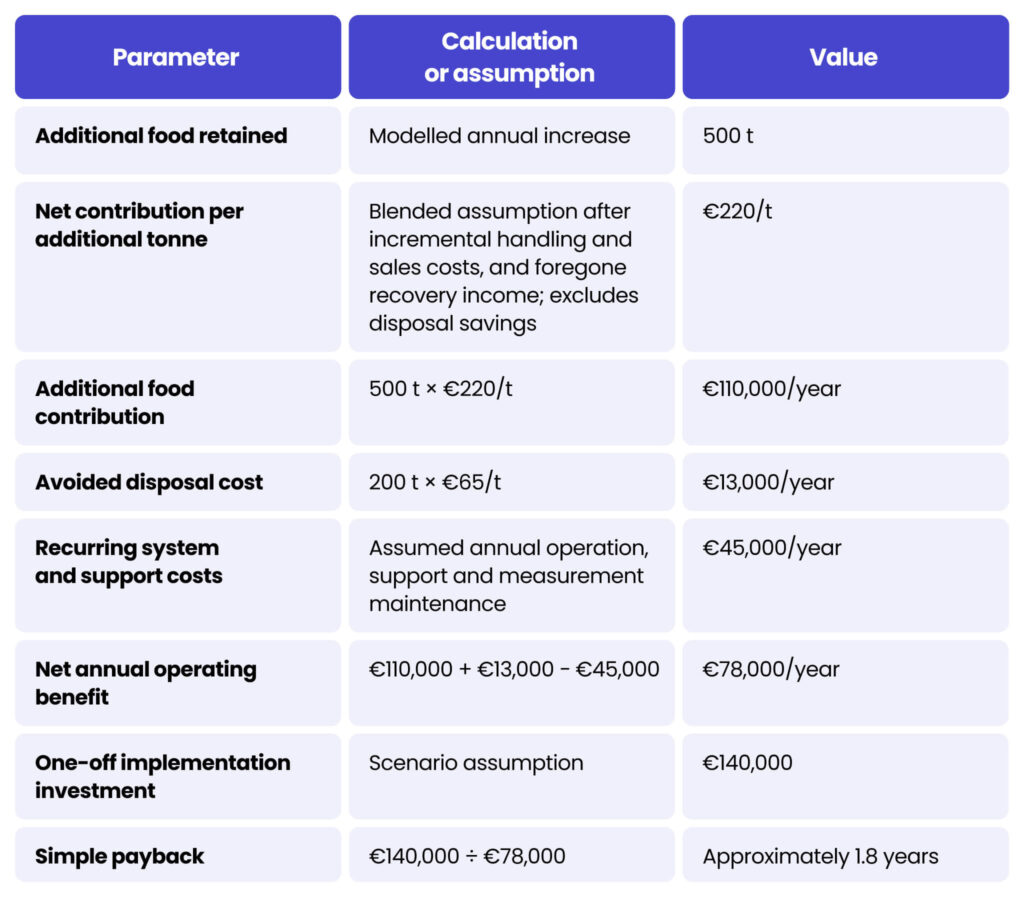
Simple payback assumes one equivalent campaign each year, full realisation of the modelled benefits, and no ramp-up delay. It excludes financing, tax, and the time value of money.
Sensitivity matters. With only 250 additional tonnes retained in food use and 100 tonnes of avoided disposal, the same assumptions produce €16,500 in net annual benefit and approximately 8.5 years’ simple payback. A pilot should test the assumptions before the business commits to a wider rollout.
Validate results against comparable lots or periods, controlling for variety, incoming grade, season, and customer specifications. Measure data completeness, unexplained mass differences, and authorised decision times alongside material and financial outcomes. Do not count the same recovered tonne twice or assume every improvement was caused by software alone.
How Spyrosoft supports circular agriculture practices
Spyrosoft’s AgriTech engineering services bring together custom software, IoT, embedded systems, farm-system integration, data analytics, geospatial capabilities, and cloud platforms. For a circular agriculture project, these capabilities can be organised around a specific material flow rather than a stand-alone sustainability application.
Map the decision and build the missing connections
A focused engagement can identify where material value is lost, which evidence is missing, and which systems own it. The resulting delivery scope can include batch-identity mapping, source-system connectors, supplier interfaces, and workflows linking quality evidence to authorised actions. Processors and distributors gain a coherent operational view without automatically having to replace their ERP.
Make equipment data usable beyond the machine
IoT and embedded engineering can connect weighing, sensing, and machine events with farm and processing records. For equipment manufacturers, the deliverable can be a documented interface and reliable data service. For operators, the benefit is the ability to investigate resource use in the context of actual production.
Turn measurements into tested decisions
Analytics can support loss investigation, forecasting, and prioritisation. A suitable project should include baseline comparisons, user validation, monitoring, and an audit trail, not merely a dashboard or model demonstration. The business remains responsible for agronomic, food-safety, and destination-approval decisions.
A practical starting brief is one material stream, one decision owner, and an agreed set of measurable acceptance criteria. From there, the integration can expand only where operational evidence supports it.
Pilot readiness checklist for more circular agriculture
Before commissioning a platform supporting circular agriculture, use this checklist with operations, quality, finance, agronomy, and IT:
☐ Define one material stream, process boundary, and representative measurement period.
☐ Separate food uses, non-food recovery, disposal, and unexplained differences.
☐ Identify the minimum measurements and label estimated quantities.
☐ Link each lot to its origin, relevant transformations, and quality status.
☐ Assign an owner to each decision, data field, and correction process.
☐ Confirm feasible recipients, acceptance conditions, and collection capacity.
☐ Agree baseline KPIs, comparison methods, and full operating costs.
☐ Test missing data, offline operation, conflicting records, and evidence of final use.
When an item is unresolved, make it part of the pilot scope. Do not hide it behind a projected waste-reduction percentage.
Summary – operational and connected circular agriculture data
Circular agriculture becomes operational when a business can connect a material’s quantity, identity, condition, and destination with a timely decision. The five layers – Measure, Identify, Connect, Decide, and Prove – provide a way to organise that work and ensure more sustainable food production.
The objective is not to maximise the volume labelled “recycled”. It is to prevent avoidable losses, preserve suitable material in the food chain, and verify appropriate recovery from what remains. Software helps by connecting evidence and decisions; infrastructure, expertise, and viable markets determine what can actually happen.
The most useful first question for the agriculture sector is not “Which circularity platform should we buy?”; it is “Which decision are we making too late because the right data does not reach the right person?”
For more on how circular agriculture powered by proper technologies and connected data can help your company build more sustainable food systems and better circular farming practices, contact our experts using the form below.
Glossary
Circular agriculture – An approach that prevents avoidable losses and retains or recovers resources across agricultural and food systems.
Food loss and waste – Terms covering food removed from the food supply chain at different stages; measurement boundaries and treatment of inedible parts must be stated.
Side-stream – A secondary material flow from a process; the term alone does not determine safety, legal status, or suitability for reuse.
Valorisation – Recovering useful value from a material through an appropriate, feasible use.
Mass balance – A reconciliation of material inputs, outputs, stock changes, and accounted losses within a defined boundary.
Batch genealogy – The recorded relationships between lots as they are split, combined or transformed.
FEFO – First expired, first out. Stock prioritisation based on expiry rather than arrival order, subject to release and customer requirements.
ERP; MES; WMS; LIMS; FMS – Enterprise resource planning; manufacturing execution system; warehouse management system; laboratory information management system; farm management system.
IoT – Internet of Things. Connected devices that collect or exchange measurements and operational information.
Digital twin – A digital representation of a physical asset or process, updated with relevant data and models for a defined purpose.
Anaerobic digestion – Biological treatment without oxygen that produces biogas and digestate; suitability and subsequent use require assessment.
CO₂-equivalent – A unit expressing different greenhouse gases using a specified global-warming-potential basis and time horizon.
Audit trail – A traceable history of evidence, decisions, corrections, and calculation versions.
References
- United Nations Environment Programme (2024). Food Waste Index Report 2024. Global estimates relate to 2022 and cover retail, food service and households.
- Vahdanjoo, M., Sørensen, C. G. and Nørremark, M. (2025). Digital transformation of the agri-food system. Current Opinion in Food Science, 63, 101287. DOI: 10.1016/j.cofs.2025.101287.
- Wang, Y., Ying, H., Stefanovski, D. et al. (2025). Food waste used as a resource can reduce climate and resource burdens in agrifood systems. Nature Food, 6, 478–490. DOI: 10.1038/s43016-025-01140-z.
FAQ
Yes. Start with a defined crop or harvest stream, existing weighing records, and a simple digital log of quantities, rejection reasons, and destinations. Record how each quantity was measured or estimated. Add sensors when the baseline reveals a specific information gap that they can resolve.
Not necessarily. First assess whether existing systems can exchange batch identifiers, quantities, quality decisions, and material movements through supported interfaces. A governed integration layer may be sufficient. Replacement becomes relevant when an essential requirement cannot be met reliably or economically with the current system.
Among batches authorised for dispatch, consider remaining shelf life, condition, transport time, and customer requirements rather than arrival date alone. Use validated quality information and preserve any holds. An estimated shelf-life score should not override a safety decision or an applicable product requirement.
Connect recommendations and field operations with harvest-lot records, rejection reasons, and marketable output. Compare similar varieties, seasons, and conditions, using matched groups where practical. Report saleable yield and resource use per tonne sold, and explain other changes that could have influenced the result.
Start with stable machine and operation identifiers, timestamps, relevant measured quantities, units, location where needed, and status or fault information. Document calibration context, data quality, and the interface. Support delayed transmission without duplicating events so receiving systems can reconstruct what happened.
A rejection does not automatically make produce suitable for another use. Confirm the reason for rejection, material characteristics, safety assessment, recipient acceptance, and applicable requirements with the responsible specialists. Keep unsuitable or unknown-status material segregated and retain the destination decision and acceptance evidence.
Tonnes diverted are not sufficient on their own. Establish the baseline destination, actual treatment, transport, energy use, and any justified substitution effects. Use a documented method and appropriate factors. Report uncertainty and keep avoided emissions estimates distinct from the organisation’s emissions inventory.


arrow_circle_rightContact us
Let’s discuss how we can help you with your AgriTech projects

arrow_circle_right Our articles