AI insights into stock market trends: cracking the code with Lazy Prices
Business need
As part of the ‘proof of concept’ built for the company’s needs, we also tried to examine the possibility of predicting which shares will gain or lose value. Our analysis, however, was based on the analysis of the text.
All US listed companies are required to publish quarterly and annual reports that describe their financial condition. Reports have an imposed structure that defines which chapters should be included in them.
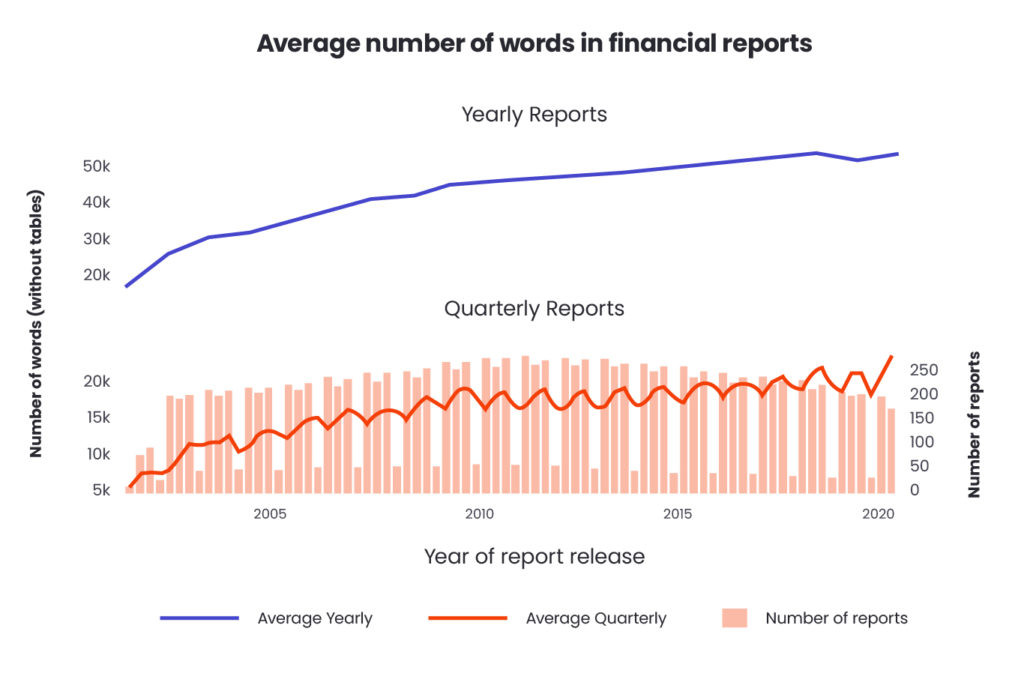
Over the course of a year the companies publish three quarterly reports (called 10-Q) and one annual report (called 10-K). Stock market reports are not an easy or pleasant read. They are frighteningly long. Microsoft’s last annual report was 130 pages long.
The language they are written in is very official, legal and repetitive. Additionally, the average length of reports, in terms of the number of words used, increases practically every year, which is shown in the chart below.
For stock market analysts, financial data is of crucial importance as it informs about profit or loss and is presented in clear tables.
It is possible that these are the only facts that will be noticed by a stock market analyst who has several dozen 100-page reports to read at the end of the year.
Three economists: Lauren Cohen, Christopher Malloy of Harvard Business School, and Quoc Nguyen of DePaul University state in their work called ‘Lazy Prices‘ that, by comparing stock market reports, we can predict a decrease or increase in stock shares of a given company.
The researchers used text analytics techniques to calculate the similarities between the SEC fillings (reports). They proved the hypothesis that companies whose reports are largely similar to their versions from the previous year, will be gaining in the stock market.
On the other end of the scale, companies whose reports contain many differences, are exposed to future price drops or even bankruptcy. This may also be interpreted as the hypothesis that stable companies will do better on the stock exchange market.
In order to compare reports, researchers use measures that calculate text similarity, such as the cosine and the Jaccard similarity.
Our services
We wanted to verify the hypothesis presented by the researchers. That’s why we decided to download thousands of stock market reports. Using NLP methods, we conducted our own analysis to confirm the premise of the hypothesis.
Data scrapping and cleaning
In the initial stage, an automatic scrapper was written, which downloaded reports from over 200 randomly selected companies from the American stock exchange from the past 20 years.
In the initial stage of text analysis, there are often steps performed to clear the text and reduce the occurrences of rare words. A few of the basic methods that allow you to get better results in the following analysis, are:
a) stemming-operation leaves only the subject of the word; its goal is to transform a word that appears in different variations to the same form. An example may be to reduce each of the words “fly”, “flying”, “flies” to one word “fly”,
b) removing stopwords – it is a common practice to remove words that occur very often and do not add additional information to the text. Especially when analysing the English text, it is important to remove words like “the”, “a”, “an” ,
c) removing punctuation,
d) converting capital letters to lowercase.
Calculation of similarity measures
After cleaning the text in all reports, we move on to the calculation of the similarity metrics.
Calculating the similarity between two text documents is a common task in NLP and has many practical uses. This method is used, for example, to position the results in a search engine or to recommend similar content to readers.
Obtaining a single numerical value that indicates the scale of similarity of the two documents, significantly facilitates and automates many processes related to the data analysis. There are many algorithms aimed at calculating the similarity of the documents. Some of them work based on the number of identical words in the documents, different, more advanced algorithms, build an understanding of the content of documents and place similar texts close to each other in previously trained vector space.
In our project, we used two measures that were also used in the ‘Lazy Prices’ publication. These were the cosine and Jaccard measures.
Cosine similarity is a measure of the similarity between two vectors within a given unitary space. It is expressed by the cosine value of an angle defined by two vectors and determines to what extent they are directed in a similar direction.
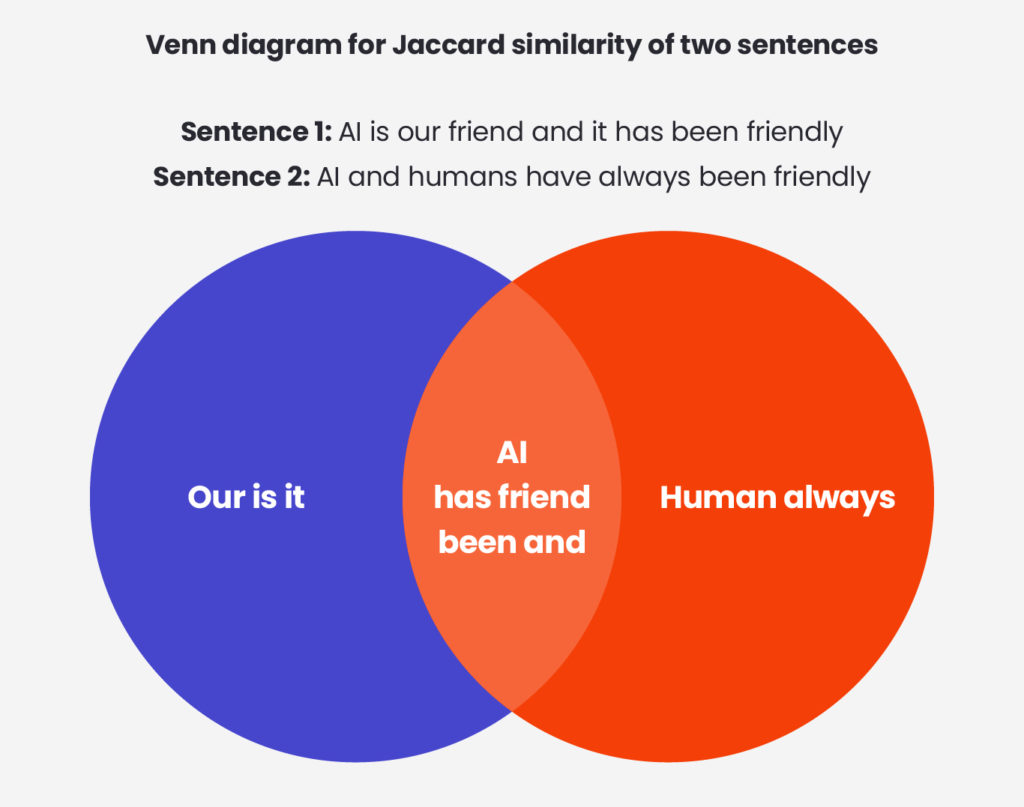
The Jaccard coefficient measures the similarity of sets by computing the quotient of the number of elements common to the sum of both sets.
In order to use the cosine measure and the Jaccard measure to calculate the similarity of documents, it is necessary to map them to a vector space.
For this purpose, all words appearing in at least one stock report are collected. Then, each report is converted into a vector representing numbers that correspond to the number of times a given word occurs in the analysed report.
The vectors thus created are used to calculate both measures of similarity.
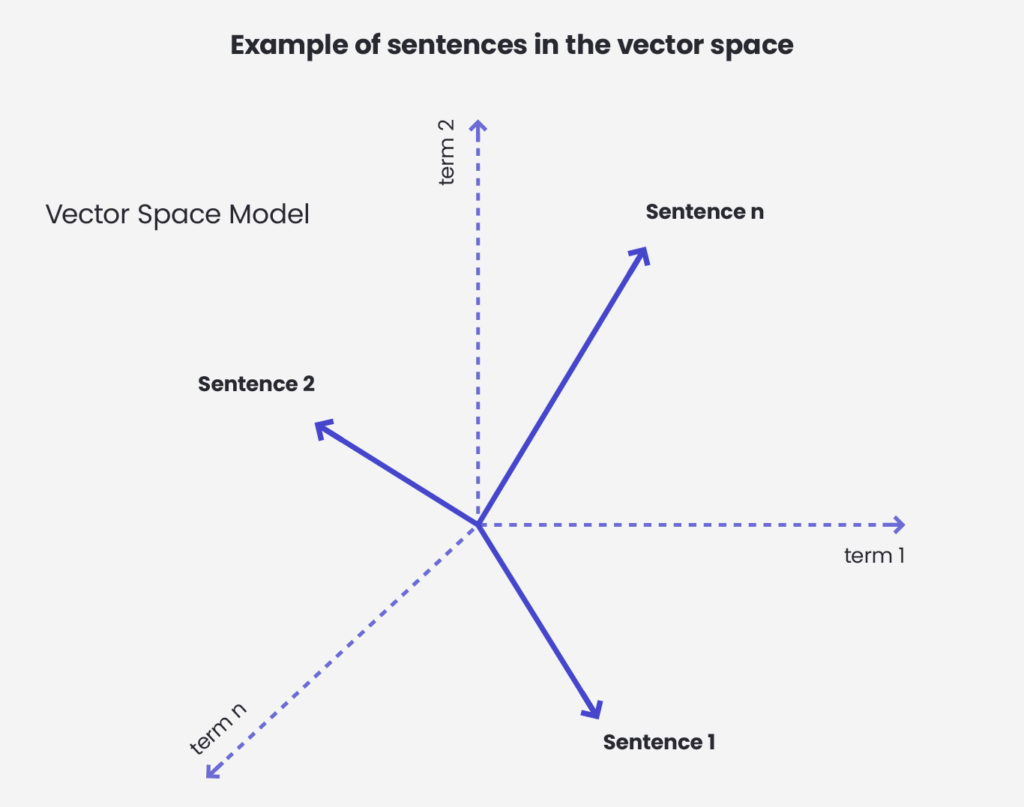
In the picture above we can see an example in which sentences are projected on a vector space. To calculate the cosine similarity of two sentences we would calculate a cosine between their corresponding vectors.
Below we present how Jaccard Similarity is calculated. For two sentences we calculate the quotient of the number of words common to the number of all unique words in both sentences.
Price change analysis
In order to check the correlation between the similarity of reports from subsequent years and the company’s financial condition, the historical prices of all analysed companies were collected, starting from the date of publication of the oldest SEC filling.
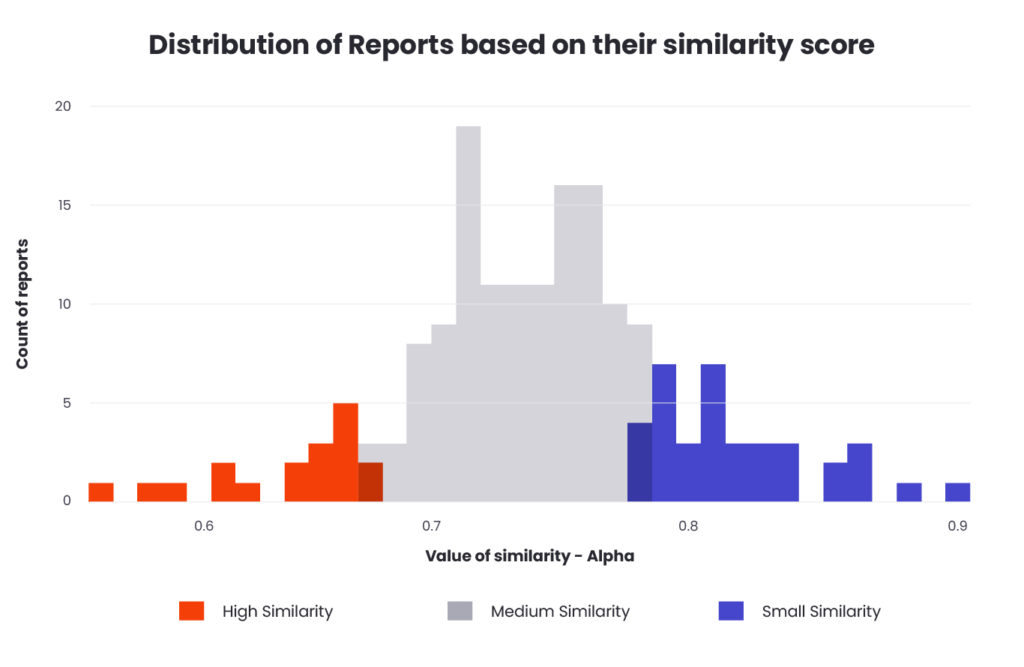
All reports have been grouped into those with small (below the 10th percentile), medium (between the 10th and 80th percentile) and large (above the 80th percentile) similarity. In each reporting period, the values of the respective percentiles were calculated by normalising according to the similarities of all reports from that period.
According to ‘Lazy Prices’, in order to observe changes in the company’s condition, it is necessary to wait three months after we purchase a given stock, which we do one month after the release of a report. On this basis, we will test the hypothesis by calculating the potential return on the purchase of a given share on the day of publishing the report and selling it after three months.
In the next step, we will calculate the average returns for each of the stock groups (low, medium and high similarity). Assuming the hypothesis is true, we expect increases in the high similarity group and decreases in the low similarity group.
The results
We presented the analysis as an interactive application written using the Streamlit library. The charts show the average returns 1, 2, 3, 4, 5 and 6 months after buying the stock. According to the assumed strategy, we focus on the return after the third month. The colour of the lines indicates the similarity group.
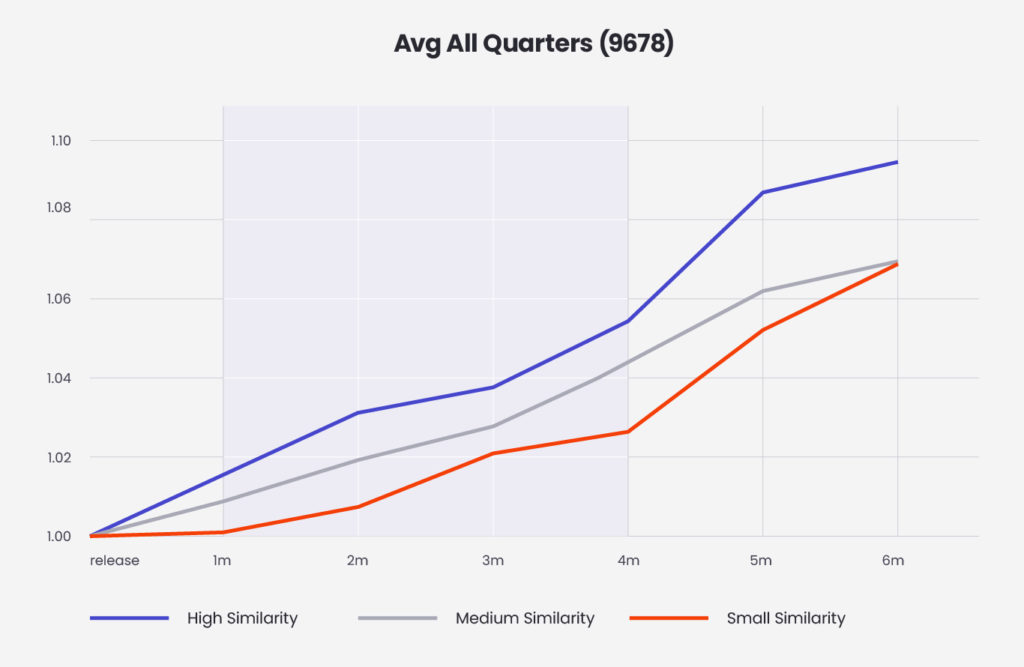
On the chart, we observe a positive return regardless of the group of similarity of reports. We buy stock at “1m” – one month after the report was released. We sell the stock at “4m” – three months after the purchase. This is because the analysis was carried out on historical stock market data from the last 20 years. During this period, on average, all stocks recorded an increase in prices. Hence, it is difficult to find a subset of stocks that would drop if averaged.
What is interesting, however, is the clear difference between the groups. Shares of companies, whose reports were very similar, achieved a profit higher by over 3 pp after 3 months which suggests that the hypothesis put forward in ‘Lazy Prices’ may be true.
It is also surprising that we managed to obtain such results using very basic techniques for measuring the similarity of the text. The next steps that could improve the quality of our prediction of growing companies may be the introduction of advanced measures based on algorithms such as word2vec or transformers. In addition, instead of calculating historical returns, we may try to build an ML model that, using the values of various measures of similarity, will attempt to solve the regression problem and predict the exact value of the share price change after three months.
Are you interested in learning more or have a AI project we could help you with? Contact our team using the form below.
Case Studies
Read the success stories of our clients


ARTIFICIAL INTELLIGENCE AND MACHINE LEARNING